

Lithium production has grown exponentially over the last few decades. Which countries produce the most lithium, and how how has this mix evolved?
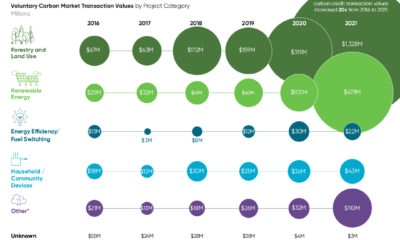

Carbon credits from nature-based solutions are in high demand as organizations look to shrink their carbon footprints.
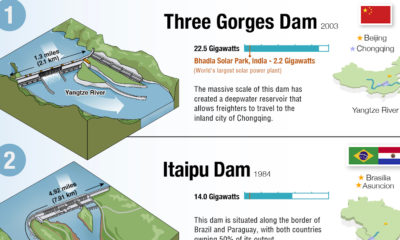

Hydroelectric dams generate 40% of the world's renewable energy, the largest of any type. View this infographic to learn more.
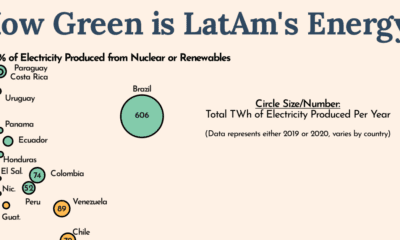

Countries around the world are looking to decarbonize, but Latin America is leading the charge in green energy usage.
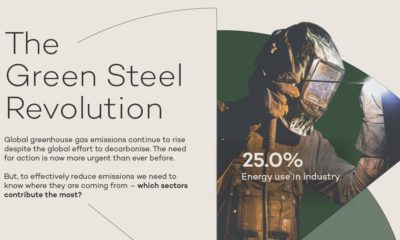

How will high emission industries respond to climate change? We highlight industrial emissions and hydrogen's role in green steel production.
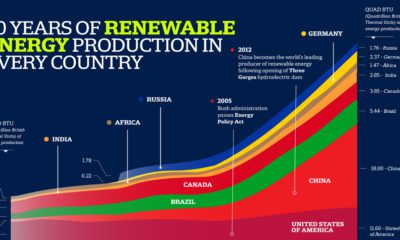

Here's a snapshot of global energy production, and which countries have produced the most fossil fuels, nuclear, and renewable energy since 1980.
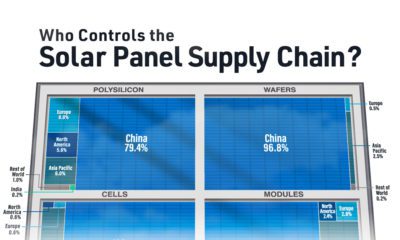

The supply chain is key for the renewable energy revolution, and this chart visualizes where the world's solar panels are manufactured.

This infographic explores the exponential growth of the technologies that are shaping the new era of energy.
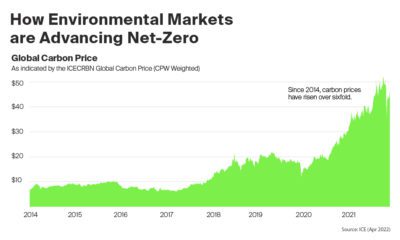

The global price of carbon increased 91% in 2021. Below, we show how environmental markets are supporting a greener future.
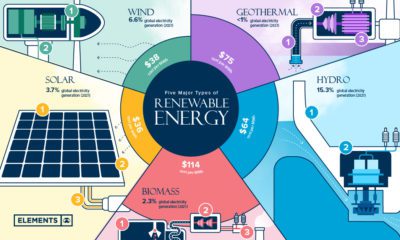

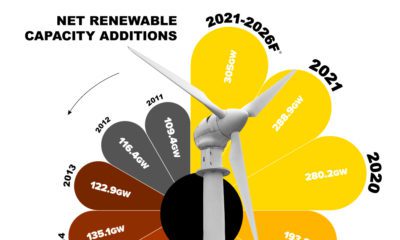
Renewable energy is the foundation of the ongoing energy transition. What are the key types of renewable energy, and how do they work?


 Creator Program