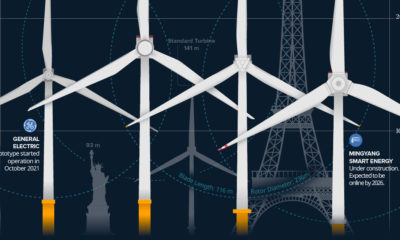

The biggest wind turbines can reach over 200 meters and cost more than $12 million to manufacture and install.
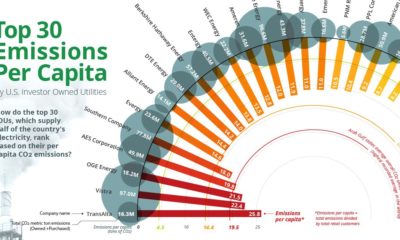

Roughly 25% of all GHG emissions come from electricity production. See how the top 30 IOUs rank by emissions per capita.
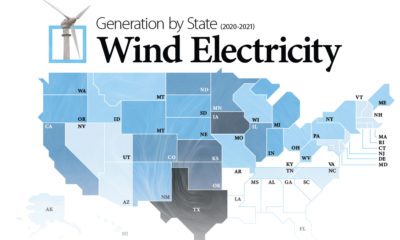

Wind energy is the largest source of renewable electricity in North America. This graphic maps U.S. states by wind electricity generation.
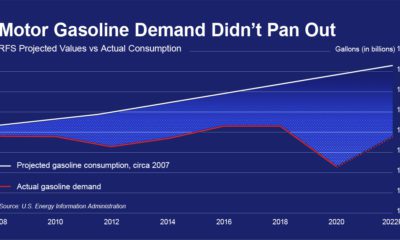

Biofuel mandates were passed in 2005, this graphic shows why they've become out of touch with modern transportation and are costing billions.
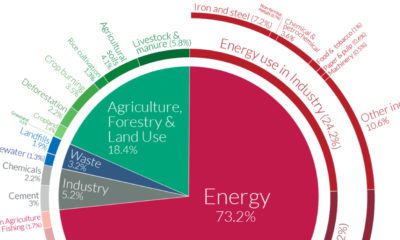

A Global Breakdown of Greenhouse Gas Emissions by Sector In a few decades, greenhouse gases (GHGs)—chiefly in the form of CO₂ emissions—have risen at unprecedented rates...
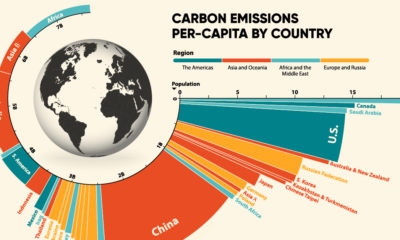

33.6 Gt of CO2 was emitted across the world in 2019. Here we visualize the global per capita CO2 emissions by country and region.
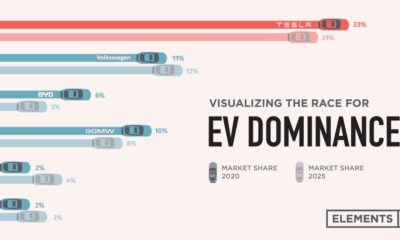

Tesla was the first automaker to hit a $1 trillion market cap, but other electric car companies have plans to unseat the dominant EV maker.
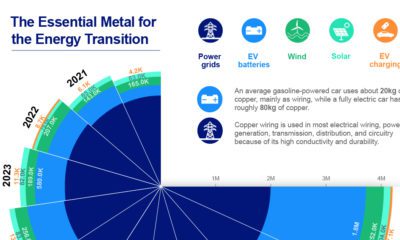

Global copper demand for alternative energy sources is expected to jump from 2.1 million tonnes in 2020 to 4.3 million tonnes in 2030.
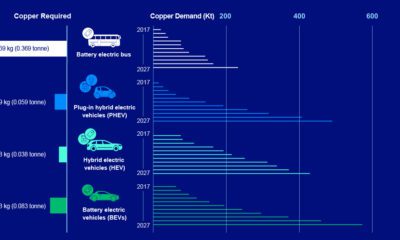

As the world moves towards renewable energy technologies, copper will remain the most widely used metal. Here’s a snapshot of copper’s role in a low-carbon economy...
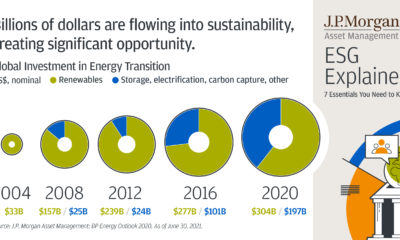

Want to invest in ESG, but not sure where to start? Begin with these 7 ESG essentials every investor should know.


 Creator Program