

Industry stars, new entrants, and local models all populate this map of the most searched-for electric vehicles by country in 2022.
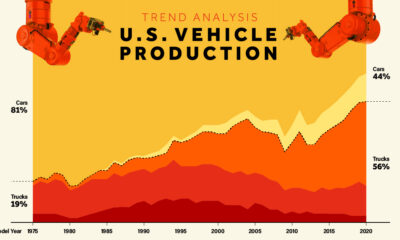

Visualize how U.S. vehicle production has shifted dramatically from cars to trucks, and especially to SUVs, since 1975.


How much oil is saved by adding electric vehicles into the mix? We look at data from 2015 to 2025P for different types of EVs.
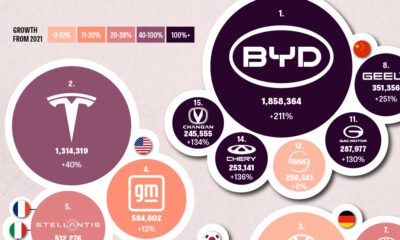

This graphic explores the latest EV production data for 2022, which shows BYD taking a massive step forward to surpass Tesla.


This infographic compares Tesla's impressive profit margins to various Western and Chinese competitors.


This infographic lists the most fuel efficient cars over the past 46 years, including the current leader for 2023.
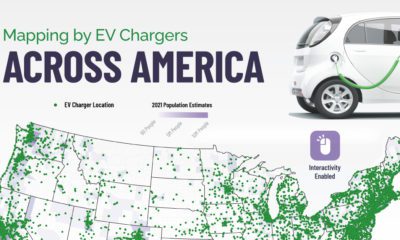

Looking for an EV charging station in the states? This interactive map contains every EV charging station in America.
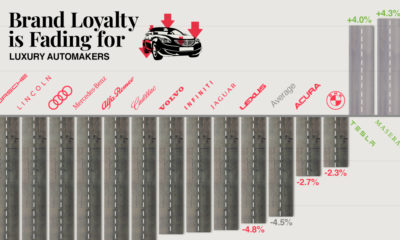

Brand loyalty has declined for most luxury automakers, but three brands—Tesla, Maserati, and Genesis—appear to have bucked the trend.
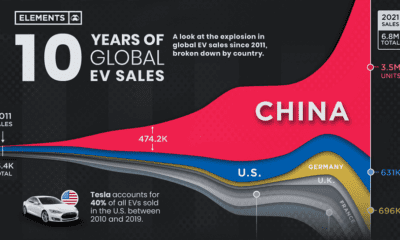

Global EV sales have grown exponentially, more than doubling in 2021 to 6.8 million units. Here's a look at EV sales by country since 2011.
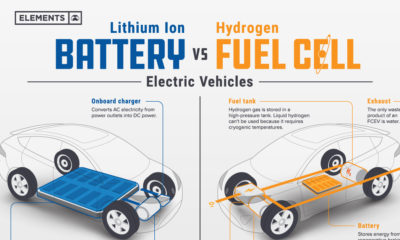

Understand the science behind hydrogen fuel cell vehicles, and how they differ from traditional EVs.


 Creator Program