Mapping U.S. Urbanization, by State


Mapping U.S. Urbanization, by State
More and more U.S. residents are choosing to make their homes in urban settings.
And with the homeowner vacancy rate already at an all-time low of 0.8% at the end of 2022, this is putting increasing pressure on housing supply.
This visualization from sponsor Boxabl is part one of the Reimagining Home Series and asks which U.S. states are most urban?
The Social Fabric of the U.S. is Urban
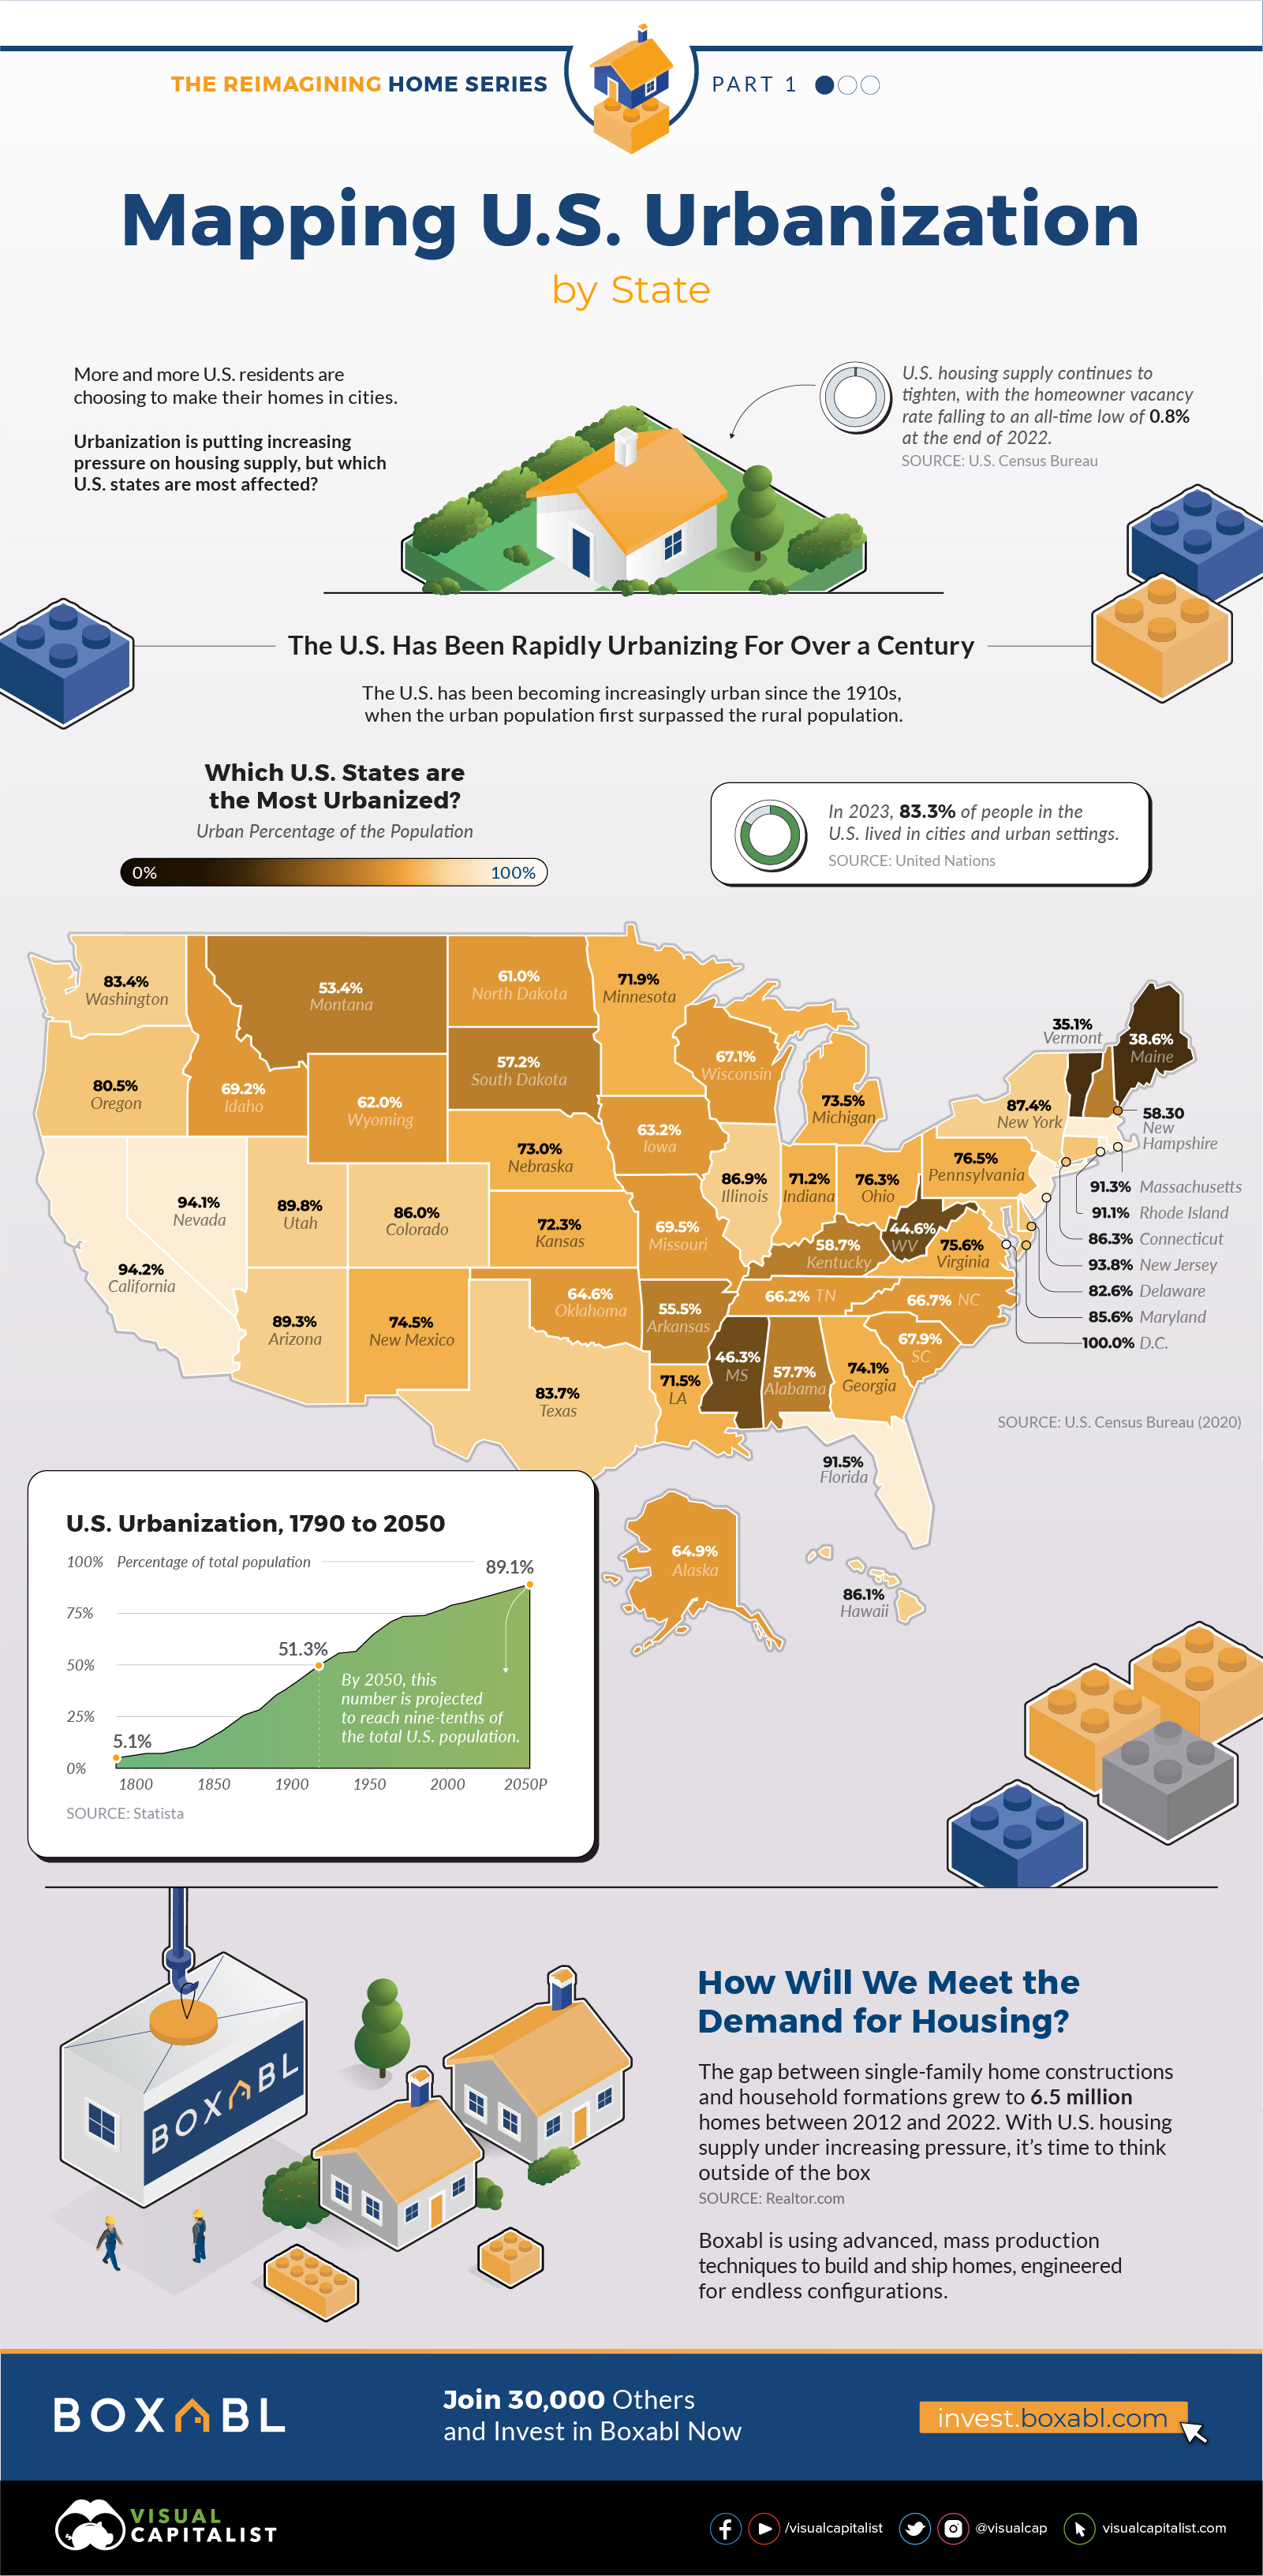
At its founding and like many other countries at the time, the U.S. was largely a rural country. In 1790, only 5.1% of U.S. residents lived in urban settings.
Rising industrialization and immigration after the U.S. Civil War and Reconstruction (1861-1877) helped drive the growth of cities. As more and more people made their homes in cities, the U.S. became more urban than rural, some time in the late 1910s.
But it wasn’t only immigrants that drove this rapid growth—rural migration also played a part. Between 1880 and 1890, almost 40% of U.S. townships experienced a population decrease, according to the Library of Congress.
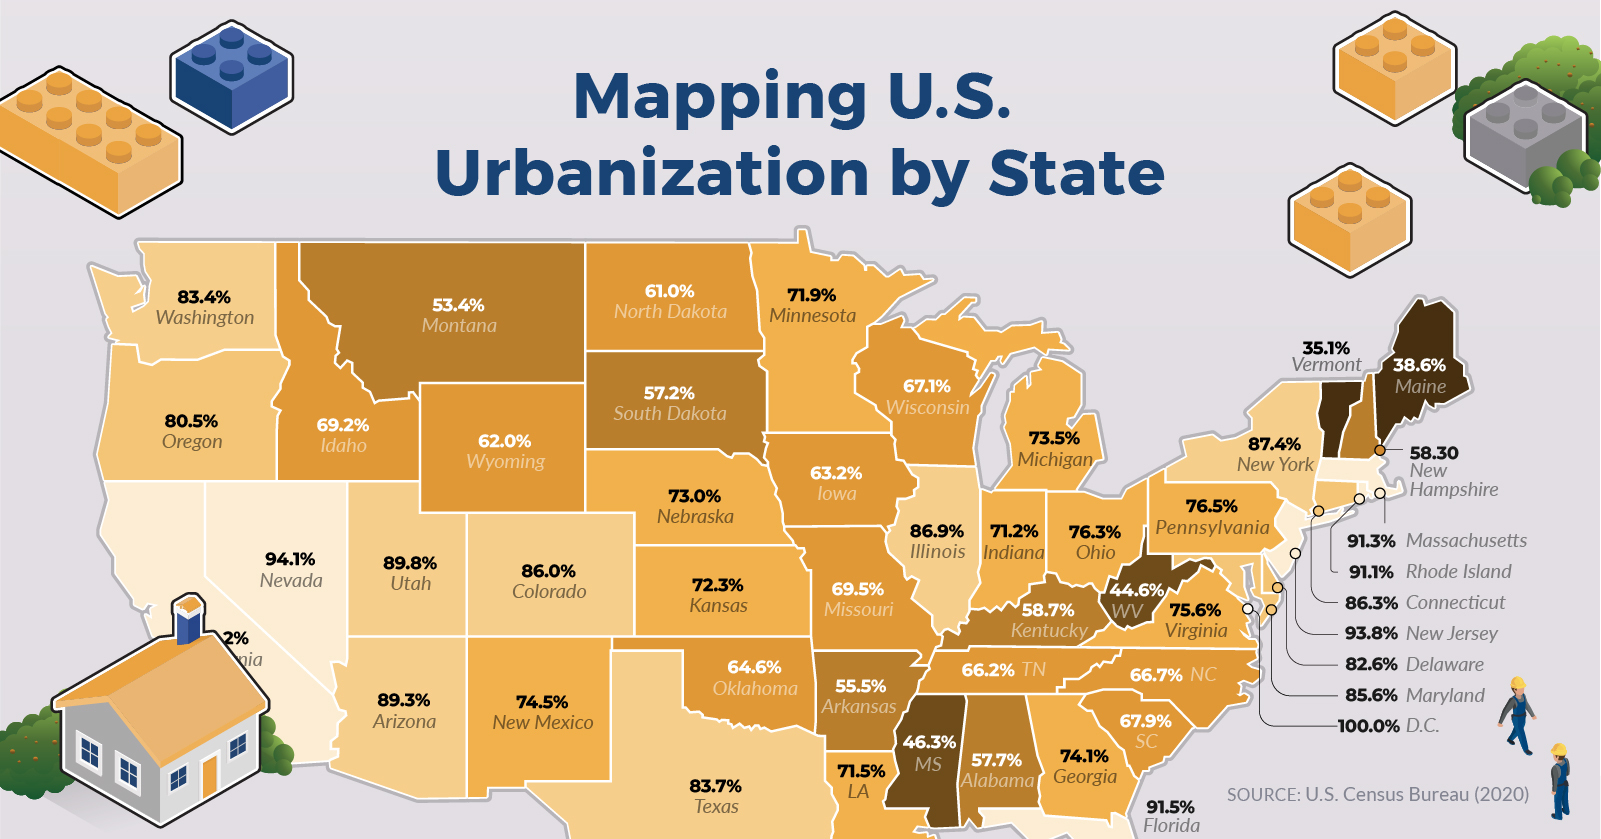
Fast forward to 2023, and 83.3% of people in the U.S. now live in an urban setting. Here are the state-by-state numbers from the 2020 U.S. Census.
| State | Urban Population | Urban Population (%) |
|---|---|---|
| Alabama | 2,900,880 | 57.70 |
| Alaska | 475,967 | 64.90 |
| Arizona | 6,385,230 | 89.30 |
| Arkansas | 1,670,677 | 55.50 |
| California | 37,259,490 | 94.20 |
| Colorado | 4,966,936 | 86.00 |
| Connecticut | 3,110,153 | 86.30 |
| Delaware | 817,817 | 82.60 |
| District of Columbia | 689,545 | 100.00 |
| Florida | 19,714,806 | 91.50 |
| Georgia | 7,933,986 | 74.10 |
| Hawaii | 1,252,450 | 86.10 |
| Idaho | 1,273,437 | 69.20 |
| Illinois | 11,137,590 | 86.90 |
| Indiana | 4,829,686 | 71.20 |
| Iowa | 2,014,831 | 63.20 |
| Kansas | 2,124,059 | 72.30 |
| Kentucky | 2,644,856 | 58.70 |
| Louisiana | 3,332,237 | 71.50 |
| Maine | 526,309 | 38.60 |
| Maryland | 5,288,760 | 85.60 |
| Massachusetts | 6,416,895 | 91.30 |
| Michigan | 7,404,258 | 73.50 |
| Minnesota | 4,101,754 | 71.90 |
| Mississippi | 1,370,790 | 46.30 |
| Missouri | 4,275,663 | 69.50 |
| Montana | 579,177 | 53.40 |
| Nebraska | 1,432,003 | 73.00 |
| Nevada | 2,921,203 | 94.10 |
| New Hampshire | 803,420 | 58.30 |
| New Jersey | 8,708,779 | 93.80 |
| New Mexico | 1,578,552 | 74.50 |
| New York | 17,665,166 | 87.40 |
| North Carolina | 6,964,727 | 66.70 |
| North Dakota | 474,989 | 61.00 |
| Ohio | 9,001,099 | 76.30 |
| Oklahoma | 2,558,611 | 64.60 |
| Oregon | 3,410,984 | 80.50 |
| Pennsylvania | 9,941,070 | 76.50 |
| Rhode Island | 999,191 | 91.10 |
| South Carolina | 3,477,869 | 67.90 |
| South Dakota | 507,347 | 57.20 |
| Tennessee | 4,577,282 | 66.20 |
| Texas | 24,400,697 | 83.70 |
| Utah | 2,937,303 | 89.80 |
| Vermont | 225,850 | 35.10 |
| Virginia | 6,528,313 | 75.60 |
| Washington | 6,424,035 | 83.40 |
| West Virginia | 800,857 | 44.60 |
| Wisconsin | 3,953,691 | 67.10 |
| Wyoming | 357,750 | 62.00 |
California (94.2%), Nevada (94.1%), and New Jersey (93.8%) were the top three most urban states in 2020, according to the U.S. decennial census. This excludes Washington, D.C., which is considered to be 100% urban.
Not surprisingly, the three most populous states also had the largest urban populations: California (37.3 million), Texas (24.4 million), and Florida (19.7 million).
On the opposite end of the spectrum, four states had rural majorities: Mississippi (46.3%), West Virginia (44.6%), Maine (38.6%), and Vermont (35.1%). Last place Vermont also had the smallest urban population at 225,850 in absolute terms.
The Rising Cost of Urbanization
With nearly 90% of U.S. residents projected to live in cities by 2050, finding a decent place to live is becoming harder and more expensive.
Median house prices in the U.S. hit an all-time high of $479,500 in the fourth quarter of 2022, before easing off slightly to $436,800 in the new year.
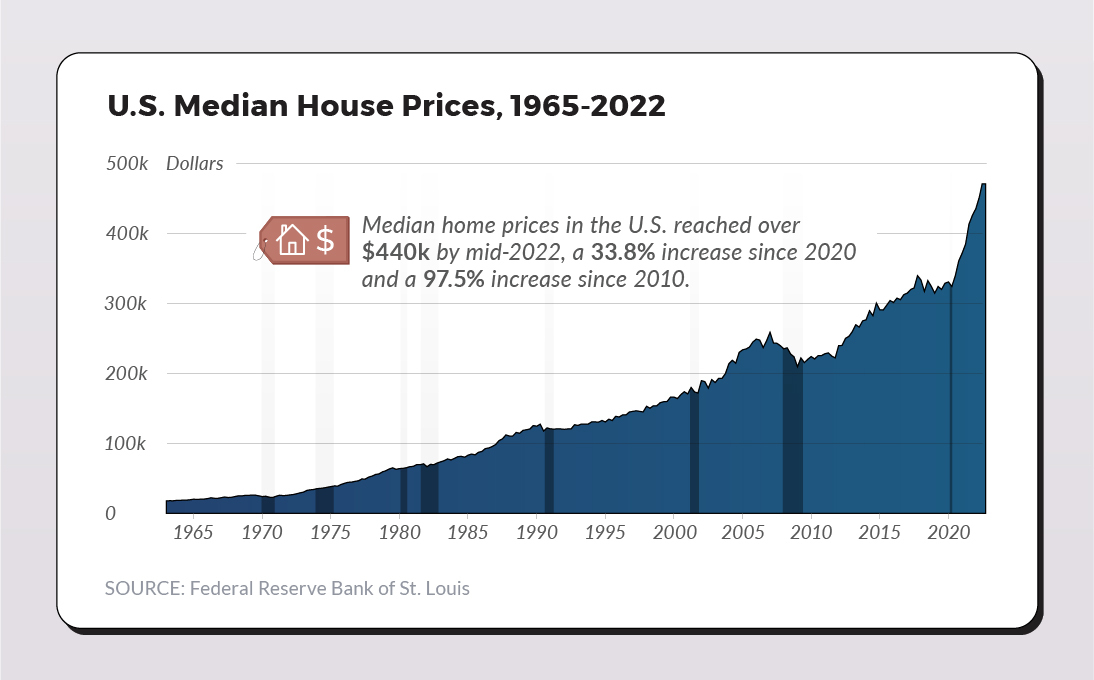
The headline national house price papers over significant regional differences, and if you lived in the Northeast and West Census Regions you would be faced with the most expensive real estate in the country.
The Northeast median house price hit a high of $699,000 in the third quarter of 2022, while the West peaked in the second quarter at $582,600.
Thinking Outside of the Box with Boxabl
U.S. housing supply is under increasing pressure, with the gap between single-family home constructions and household formations growing to 6.5 million homes between 2012 and 2022.
Boxabl uses advanced, mass production techniques to build and ship homes that significantly lower the cost of home ownership for everyone.
This is the first piece in the Reimagining Home Series from our sponsor, Boxabl. Next up in part two is an analysis of housing affordability.
Learn more about how Boxabl is helping tackle the housing affordability crisis.

-

 Real Estate2 weeks ago
Ranked: The Most Valuable Housing Markets in America
The U.S. residential real estate market is worth a staggering $47.5 trillion. Here are the most valuable housing markets in the country.
-

 Real Estate3 weeks ago
Visualizing America’s Shortage of Affordable Homes
Last year, the share of affordable homes in the U.S. reached its lowest point on record amid high interest rates and soaring home prices.
-

 Real Estate4 weeks ago
The Fastest Rising U.S. Housing Markets in 2024
As U.S. home prices hit record highs, which housing market is seen the fastest growth? This graphic shows the top 10 across the country.
-

 United States2 months ago
Charted: U.S. Median House Prices vs. Income
We chart the ever-widening gap between median incomes and the median price of houses in America, using data from the Federal Reserve from 1984 to 2022.
-
 China3 months ago
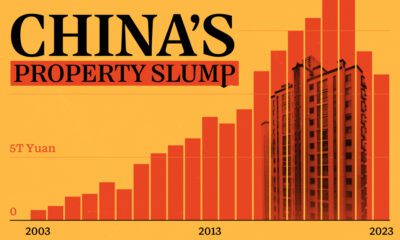
China’s Real Estate Crisis, Shown in Two Charts
These charts show China’s real estate boom in the 21st century and the subsequent slowdown since 2022.
-

 Real Estate4 months ago
Ranked: Canada’s Housing Markets, by Price Growth in 2023
House prices are climbing at a brisk rate across most of the Great White North but one Canadian housing market is seeing outsized growth.