Maps
Ranked: The World’s Largest Cities By Population
Ranked: The World’s Largest Cities By Population
The world has experienced rapid urbanization over the last century.
Today, more than 4.3 billion people live in urban settings, or 55% of the world’s population.
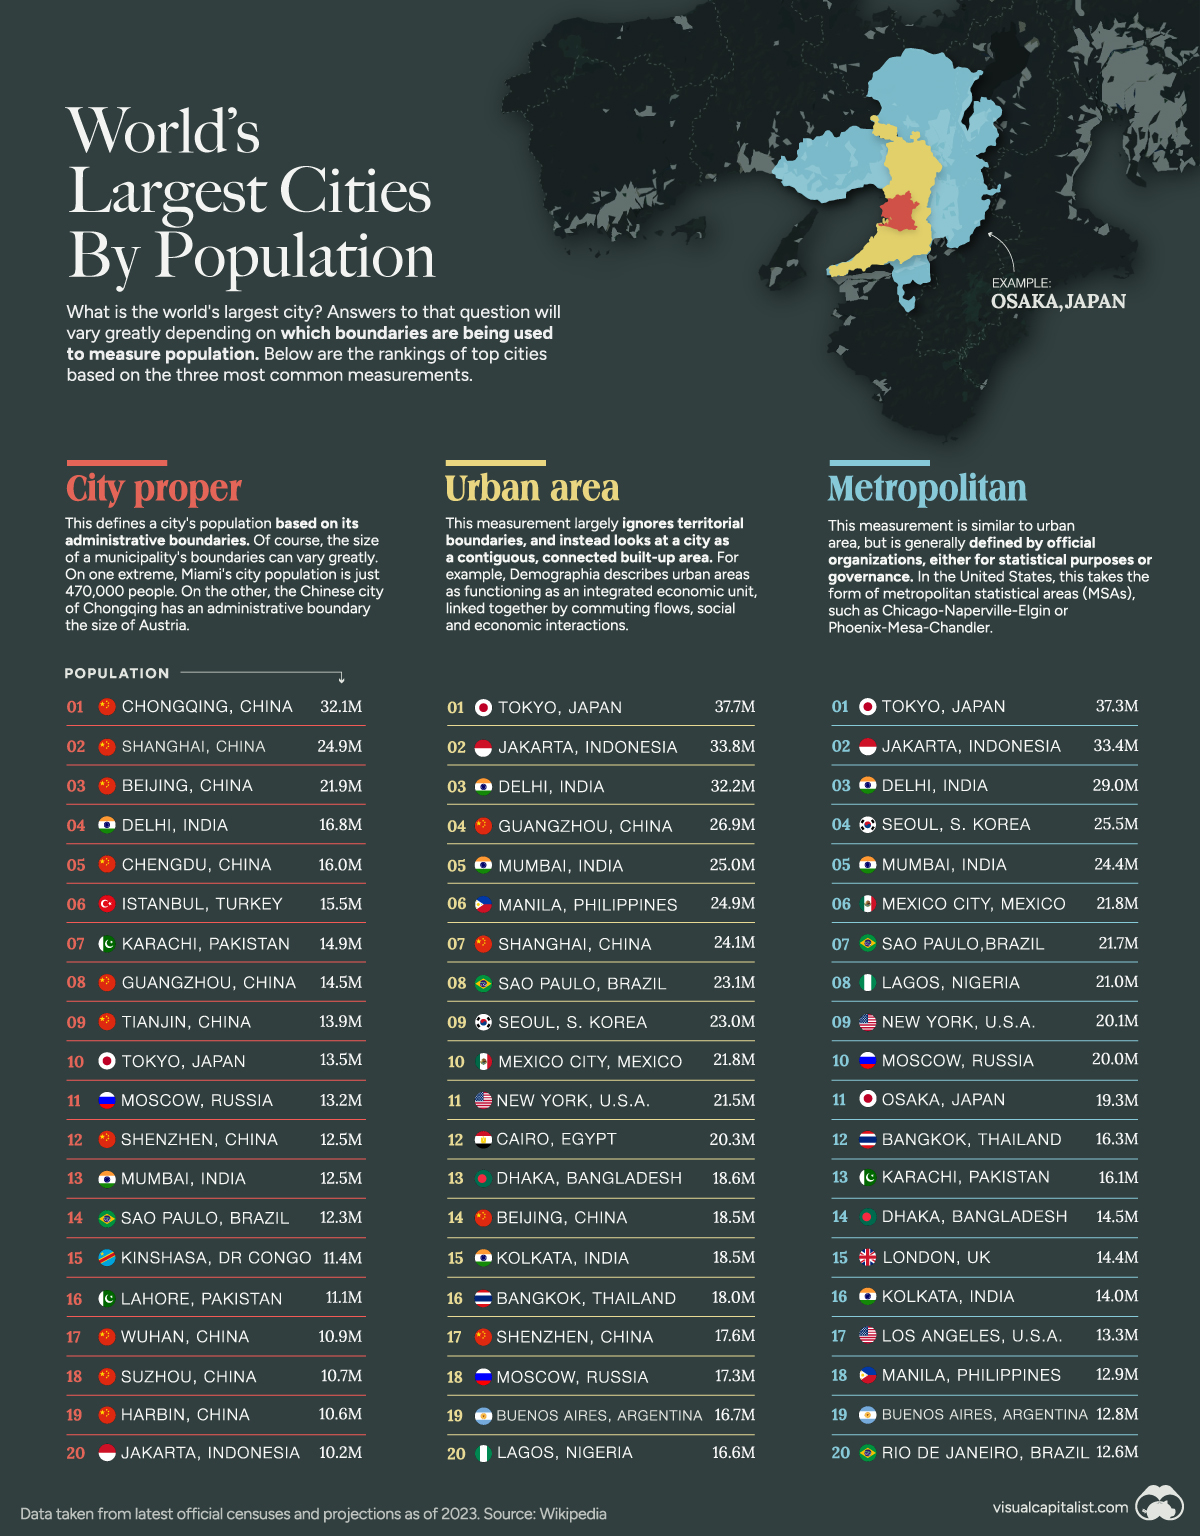
But what is the world’s largest city? Answers to that question will vary greatly depending on which lines are being used to demarcate city boundaries and measure their populations.
The graphic above uses data taken from the latest official censuses and projections to rank the top cities based on the three most common metrics.
The Largest Cities by City Proper
Our first metric is based on the city proper, meaning the administrative boundaries.
According to the United Nations, a city proper is “the single political jurisdiction which contains the historical city center.”
The Chinese city of Chongqing leads the ranks by this metric and has an administrative boundary the size of Austria, with an urban population of 32.1 million.
The city’s monorail system holds records for being the world’s longest and busiest, boasting 70 stations. Chongqing Jiangbei International Airport, is among the world’s top 50 busiest airports. Additionally, the city ranks among the globe’s top 50 hubs for scientific research.
Other Chinese cities dominate the ranking by this metric:
| Rank | City | Population (Million) |
|---|---|---|
| #1 | 🇨🇳 Chongqing | 32.1m |
| #2 | 🇨🇳 Shanghai | 24.9m |
| #3 | 🇨🇳 Beijing | 21.9m |
| #4 | 🇮🇳 Delhi | 16.8m |
| #5 | 🇨🇳 Chengdu | 16.0m |
| #6 | 🇹🇷 Istanbul | 15.5m |
| #7 | 🇵🇰 Karachi | 14.9m |
| #8 | 🇨🇳 Guangzhou | 14.5m |
| #9 | 🇨🇳 Tianjin | 13.9m |
| #10 | 🇯🇵 Tokyo | 13.5m |
The first non-Chinese city, Delhi, has been experiencing one of the fastest urban expansions in the world.
The United Nations projects India will add over 400 million urban dwellers by 2050, compared to 250 million people in China and 190 million in Nigeria.
The Largest Cities by Urban Area
This measurement largely ignores territorial boundaries and considers a city a contiguous, connected built-up area.
Demographia describes urban areas as functioning as an integrated economic unit, linked by commuting flows, social, and economic interactions.
By this metric, Tokyo leads the ranking:
| Rank | City | Population (Million) |
|---|---|---|
| #1 | 🇯🇵 Tokyo | 37.7m |
| #2 | 🇮🇩 Jakarta | 33.8m |
| #3 | 🇮🇳 Delhi | 32.2m |
| #4 | 🇨🇳 Guangzhou | 26.9m |
| #5 | 🇮🇳 Mumbai | 25.0m |
| #6 | 🇵🇭 Manila | 24.9m |
| #7 | 🇨🇳 Shanghai | 24.1m |
| #8 | 🇧🇷 Sao Paulo | 23.1m |
| #9 | 🇰🇷 Seoul | 23.0m |
| #10 | 🇲🇽 Mexico City | 21.8m |
The city proper houses about 10% of Japan’s population. If the greater Tokyo metro area is considered, including cities like Kanagawa, Saitama, and Chiba, then Tokyo’s total population surpasses 37 million—about 30% of the country total.
Consequently, even with one of the world’s largest railway systems, trains in Tokyo are incredibly crowded, with a boarding rate of 200% during peak time in the most overcrowded areas. The city is also famous for its Shibuya Crossing, the busiest intersection on the planet.
The Largest Cities by Metropolitan Area
Tokyo also leads by our final metric, metropolitan area.
This measurement is similar to urban area, but is generally defined by official organizations, either for statistical purposes or governance.
In the United States, this takes the form of metropolitan statistical areas (MSAs), such as Chicago-Naperville-Elgin or Phoenix-Mesa-Chandler.
| Rank | City | Population (Million) |
|---|---|---|
| #1 | 🇯🇵 Tokyo | 37.3m |
| #2 | 🇮🇩 Jakarta | 33.4m |
| #3 | 🇮🇳 Delhi | 29.0m |
| #4 | 🇰🇷 Seoul | 25.5m |
| #5 | 🇮🇳 Mumbai | 24.4m |
| #6 | 🇲🇽 Mexico City | 21.8m |
| #7 | 🇧🇷 Sao Paulo | 21.7m |
| #8 | 🇳🇬 Lagos | 21.0m |
| #9 | 🇺🇸 New York | 20.1m |
| #10 | 🇷🇺 Moscow | 20.0m |
As the global urban population continues to rise, new cities, especially in Africa and Asia, are expected to vie for the “largest” tag soon.
The UN projects that by 2050, 68% of the world will live in urban areas.


Demographics
Mapped: U.S. Immigrants by Region
This map shows which regions U.S. immigrants came from, highlighting Asia and Latin America as the biggest sources.


Breaking Down America’s Immigrant Population
This was originally posted on our Voronoi app. Download the app for free on iOS or Android and discover incredible data-driven charts from a variety of trusted sources.
The United States is home to more immigrants than any other nation, surpassing the combined totals of the next four countries: Germany, Saudi Arabia, Russia, and the United Kingdom.
To add context to this impressive fact, we’ve illustrated the regions from which U.S. immigrants originated. “Immigrants” in this context refers to individuals who are residing in the United States but were not U.S. citizens at birth.
These statistics were sourced from the Migration Policy Institute, which analyzed data from the U.S. Census Bureau’s 2022 American Community Survey (ACS).
U.S. Immigrants by Region
From this graphic, we can see that Asia and Latin America emerge as the primary sources of immigration, collectively accounting for 81% of America’s 46.2 million immigrants.
| Region | # of Immigrants | % of Total |
|---|---|---|
| Europe | 4,728,948 | 10 |
| Asia | 14,349,080 | 31 |
| Africa | 2,752,965 | 6 |
| Oceania | 288,560 | 1 |
| Northern America | 828,702 | 2 |
| Latin America | 23,233,834 | 50 |
| Total | 46,182,089 | 100 |
Latin America alone contributes half of the immigrant population. Mexico stands out as the largest contributor to U.S. immigration, with 10.7 million immigrants, attributable to its geographical proximity and historical ties.
Economic factors, including wage disparity and employment opportunities, drive many Mexicans to seek better prospects north of the border.
From Asia, the two largest country sources are China (2.2 million) and India (2.8 million).
Learn More About U.S. Immigration From Visual Capitalist
If you enjoyed this post, be sure to check out Why Do People Immigrate to the U.S.? This visualization shows the different reasons why immigrants chose to come to America in 2021.

-

 Brands5 days ago
The Evolution of U.S. Beer Logos
-

 Culture2 weeks ago
The World’s Top Media Franchises by All-Time Revenue
-

 voronoi2 weeks ago
Best Visualizations of April on the Voronoi App
-

 Wealth2 weeks ago
Charted: Which Country Has the Most Billionaires in 2024?
-

 Business1 week ago
The Top Private Equity Firms by Country
-

 Markets1 week ago
The Best U.S. Companies to Work for According to LinkedIn
-

 Economy1 week ago
Ranked: The Top 20 Countries in Debt to China
-

 Politics1 week ago
Charted: Trust in Government Institutions by G7 Countries