Markets
Visualizing Portfolio Return Expectations, by Country
Subscribe to the Advisor Channel free mailing list for more like this
Visualizing Portfolio Return Expectations, by Country
This was originally posted on Advisor Channel. Sign up to the free mailing list to get beautiful visualizations on financial markets that help advisors and their clients.
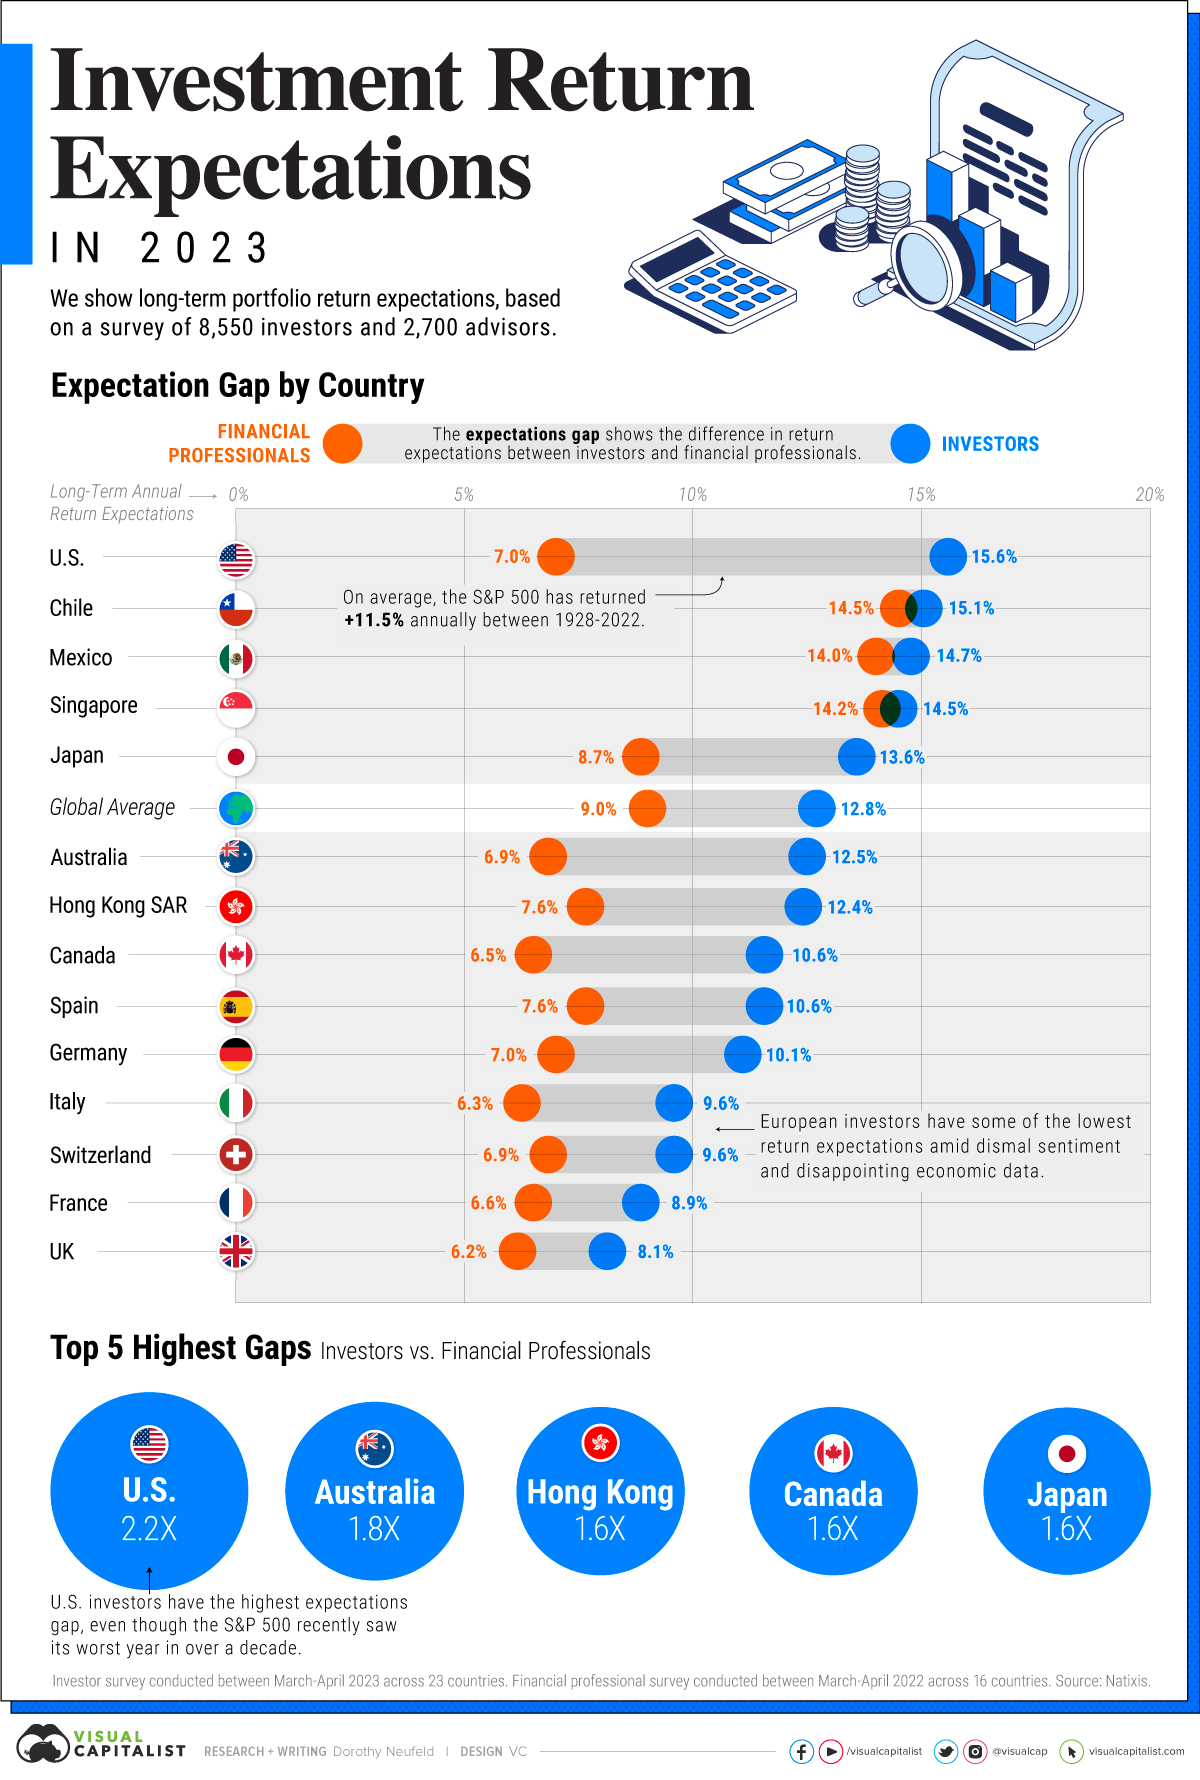
How do investors’ return expectations differ from those of advisors? How does this expectation gap shift across countries?
Despite 2022 being the worst year for stock markets in over a decade, investors around the world appear confident about the long-term performance of their portfolios. These convictions point towards resilience across global economies, driven by strong labor markets and moderating inflation.
While advisors are optimistic, their expectations are more conservative overall.
This graphic shows the return expectation gap by country between investors and financial professionals in 2023, based on data from Natixis.
Expectation Gap by Country
Below, we show the return expectation gap by country, based on a survey of 8,550 investors and 2,700 financial professionals:
| Long-Term Annual Return Expectations | Investors | Financial Professionals | Expectations Gap |
|---|---|---|---|
| 🇺🇸 U.S. | 15.6% | 7.0% | 2.2X |
| 🇨🇱 Chile | 15.1% | 14.5% | 1.0X |
| 🇲🇽 Mexico | 14.7% | 14.0% | 1.1X |
| 🇸🇬 Singapore | 14.5% | 14.2% | 1.0X |
| 🇯🇵 Japan | 13.6% | 8.7% | 1.6X |
| 🇦🇺 Australia | 12.5% | 6.9% | 1.8X |
| 🇭🇰 Hong Kong SAR | 12.4% | 7.6% | 1.6X |
| 🇨🇦 Canada | 10.6% | 6.5% | 1.6X |
| 🇪🇸 Spain | 10.6% | 7.6% | 1.4X |
| 🇩🇪 Germany | 10.1% | 7.0% | 1.4X |
| 🇮🇹 Italy | 9.6% | 6.3% | 1.5X |
| 🇨🇭 Switzerland | 9.6% | 6.9% | 1.4X |
| 🇫🇷 France | 8.9% | 6.6% | 1.3X |
| 🇬🇧 UK | 8.1% | 6.2% | 1.3X |
| 🌐 Global | 12.8% | 9.0% | 1.4X |
Investors in the U.S. have the highest long-term annual return expectations, at 15.6%. The U.S. also has the highest expectations gap across countries, with investors’ expectations more than double that of advisors.
Likely influencing investor convictions are the outsized returns seen in the last decade, led by big tech. This year is no exception, as a handful of tech giants are seeing soaring returns, lifting the overall market.
From a broader perspective, the S&P 500 has returned 11.5% on average annually since 1928.
Following next in line were investors in Chile and Mexico with return expectations of 15.1% and 14.7%, respectively. Unlike many global markets, the MSCI Chile Index posted double-digit returns in 2022.
Global financial hub, Singapore, has the lowest expectations gap across countries.
Investors in the UK and Europe, have the most moderate return expectations overall. Confidence has been weighed down by geopolitical tensions, high interest rates, and dismal economic data.
Return Expectations Across Asset Classes
What are the expected returns for different asset classes over the next decade?
A separate report by Vanguard used a quantitative model to forecast returns through to 2033. For U.S. equities, it projects 4.1-6.1% in annualized returns. Global equities are forecast to have 6.4-8.4% returns, outperforming U.S. stocks over the next decade.
Bonds, meanwhile, are forecast to see 3.6-4.6% annualized returns for the U.S. aggregate market, while U.S. Treasuries are projected to average 3.3-4.3% annually.
While it’s impossible to predict the future, we can see a clear expectation gap not only between countries, but between advisors, clients, and other models. Factors such as inflation, interest rates, and the ability for countries to weather economic headwinds will likely have a significant influence on future portfolio returns.


Markets
Mapped: Europe’s GDP Per Capita, by Country
Which European economies are richest on a GDP per capita basis? This map shows the results for 44 countries across the continent.


Mapped: Europe’s GDP Per Capita, by Country (2024)
This was originally posted on our Voronoi app. Download the app for free on iOS or Android and discover incredible data-driven charts from a variety of trusted sources.
Europe is home to some of the largest and most sophisticated economies in the world. But how do countries in the region compare with each other on a per capita productivity basis?
In this map, we show Europe’s GDP per capita levels across 44 nations in current U.S. dollars. Data for this visualization and article is sourced from the International Monetary Fund (IMF) via their DataMapper tool, updated April 2024.
Europe’s Richest and Poorest Nations, By GDP Per Capita
Luxembourg, Ireland, and Switzerland, lead the list of Europe’s richest nations by GDP per capita, all above $100,000.
| Rank | Country | GDP Per Capita (2024) |
|---|---|---|
| 1 | 🇱🇺 Luxembourg | $131,380 |
| 2 | 🇮🇪 Ireland | $106,060 |
| 3 | 🇨🇭 Switzerland | $105,670 |
| 4 | 🇳🇴 Norway | $94,660 |
| 5 | 🇮🇸 Iceland | $84,590 |
| 6 | 🇩🇰 Denmark | $68,900 |
| 7 | 🇳🇱 Netherlands | $63,750 |
| 8 | 🇸🇲 San Marino | $59,410 |
| 9 | 🇦🇹 Austria | $59,230 |
| 10 | 🇸🇪 Sweden | $58,530 |
| 11 | 🇧🇪 Belgium | $55,540 |
| 12 | 🇫🇮 Finland | $55,130 |
| 13 | 🇩🇪 Germany | $54,290 |
| 14 | 🇬🇧 UK | $51,070 |
| 15 | 🇫🇷 France | $47,360 |
| 16 | 🇦🇩 Andorra | $44,900 |
| 17 | 🇲🇹 Malta | $41,740 |
| 18 | 🇮🇹 Italy | $39,580 |
| 19 | 🇨🇾 Cyprus | $37,150 |
| 20 | 🇪🇸 Spain | $34,050 |
| 21 | 🇸🇮 Slovenia | $34,030 |
| 22 | 🇪🇪 Estonia | $31,850 |
| 23 | 🇨🇿 Czech Republic | $29,800 |
| 24 | 🇵🇹 Portugal | $28,970 |
| 25 | 🇱🇹 Lithuania | $28,410 |
| 26 | 🇸🇰 Slovakia | $25,930 |
| 27 | 🇱🇻 Latvia | $24,190 |
| 28 | 🇬🇷 Greece | $23,970 |
| 29 | 🇭🇺 Hungary | $23,320 |
| 30 | 🇵🇱 Poland | $23,010 |
| 31 | 🇭🇷 Croatia | $22,970 |
| 32 | 🇷🇴 Romania | $19,530 |
| 33 | 🇧🇬 Bulgaria | $16,940 |
| 34 | 🇷🇺 Russia | $14,390 |
| 35 | 🇹🇷 Türkiye | $12,760 |
| 36 | 🇲🇪 Montenegro | $12,650 |
| 37 | 🇷🇸 Serbia | $12,380 |
| 38 | 🇦🇱 Albania | $8,920 |
| 39 | 🇧🇦 Bosnia & Herzegovina | $8,420 |
| 40 | 🇲🇰 North Macedonia | $7,690 |
| 41 | 🇧🇾 Belarus | $7,560 |
| 42 | 🇲🇩 Moldova | $7,490 |
| 43 | 🇽🇰 Kosovo | $6,390 |
| 44 | 🇺🇦 Ukraine | $5,660 |
| N/A | 🇪🇺 EU Average | $44,200 |
Note: Figures are rounded.
Three Nordic countries (Norway, Iceland, Denmark) also place highly, between $70,000-90,000. Other Nordic peers, Sweden and Finland rank just outside the top 10, between $55,000-60,000.
Meanwhile, Europe’s biggest economies in absolute terms, Germany, UK, and France, rank closer to the middle of the top 20, with GDP per capitas around $50,000.
Finally, at the end of the scale, Eastern Europe as a whole tends to have much lower per capita GDPs. In that group, Ukraine ranks last, at $5,660.
A Closer Look at Ukraine
For a broader comparison, Ukraine’s per capita GDP is similar to Iran ($5,310), El Salvador ($5,540), and Guatemala ($5,680).
According to experts, Ukraine’s economy has historically underperformed to expectations. After the fall of the Berlin Wall, the economy contracted for five straight years. Its transition to a Western, liberalized economic structure was overshadowed by widespread corruption, a limited taxpool, and few revenue sources.
Politically, its transformation from authoritarian regime to civil democracy has proved difficult, especially when it comes to institution building.
Finally, after the 2022 invasion of the country, Ukraine’s GDP contracted by 30% in a single year—the largest loss since independence. Large scale emigration—to the tune of six million refugees—is also playing a role.
Despite these challenges, the country’s economic growth has somewhat stabilized while fighting continues.

-

 Markets6 days ago
Visualized: Interest Rate Forecasts for Advanced Economies
-

 Markets2 weeks ago
Economic Growth Forecasts for G7 and BRICS Countries in 2024
-

 Wealth2 weeks ago
Charted: Which City Has the Most Billionaires in 2024?
-

 Technology2 weeks ago
All of the Grants Given by the U.S. CHIPS Act
-

 Green2 weeks ago
The Carbon Footprint of Major Travel Methods
-

 United States1 week ago
Visualizing the Most Common Pets in the U.S.
-

 Culture1 week ago
The World’s Top Media Franchises by All-Time Revenue
-

 voronoi1 week ago
Best Visualizations of April on the Voronoi App