Demographics
Mapped: The Population of India’s States Compared with Countries
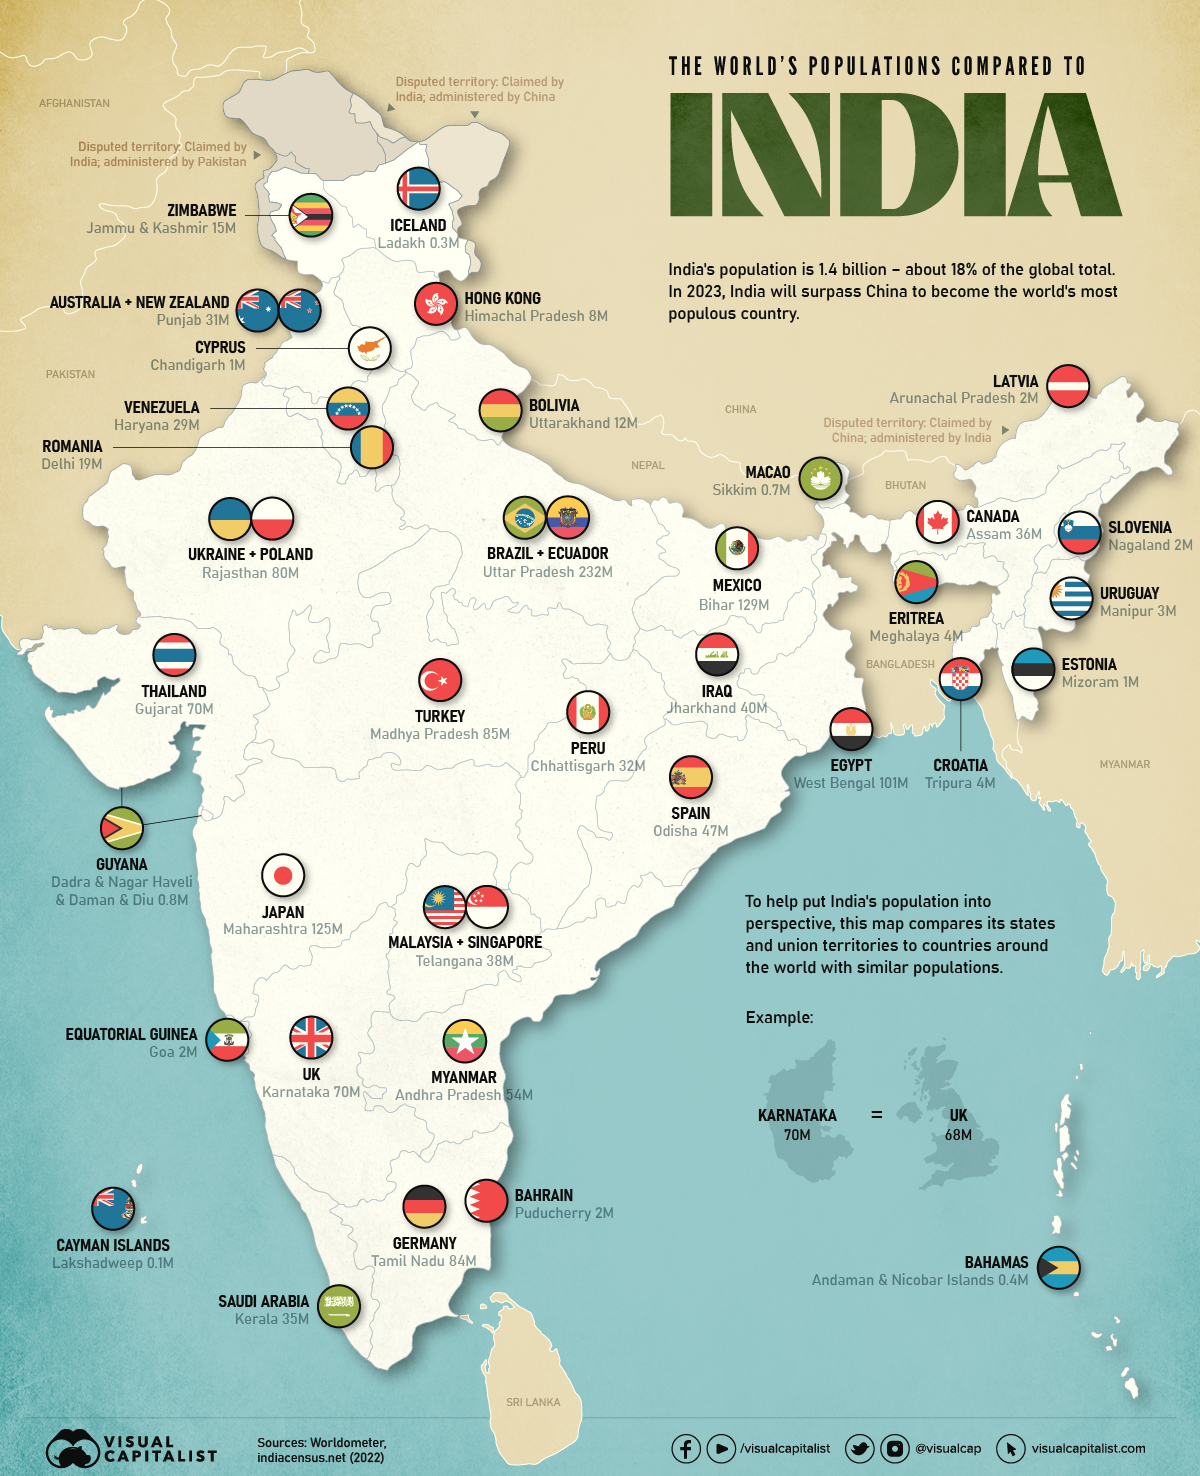


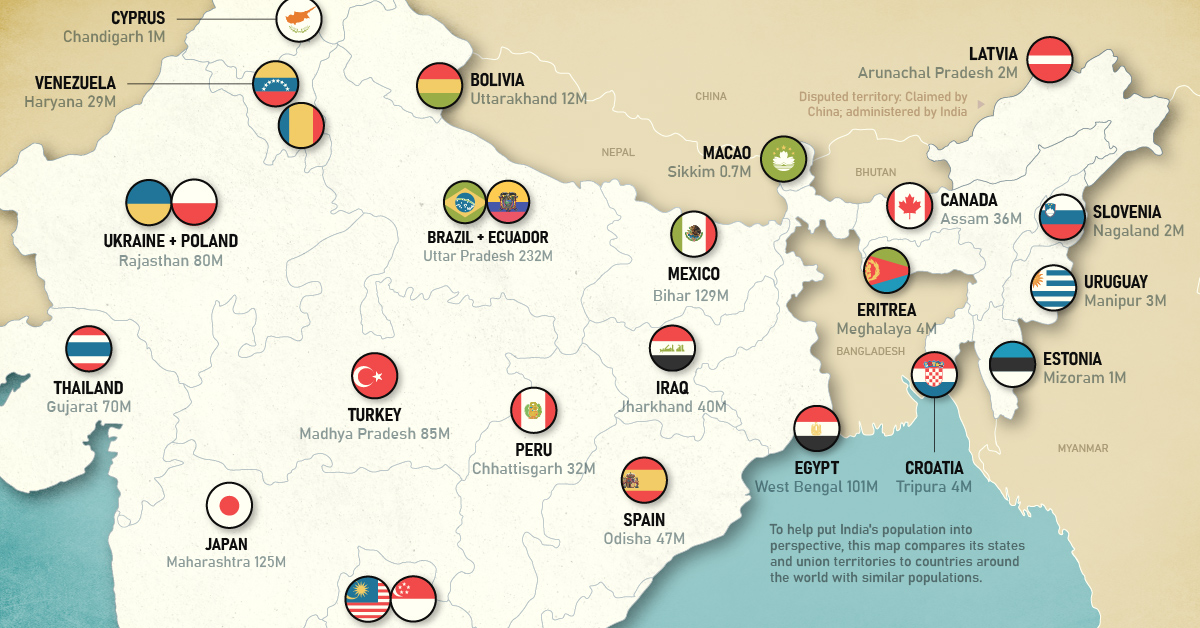
The Population of India’s States Compared with Countries
In a world with eight billion people, even the numbers of the largest population centers like China and India can start to lose their impact.
The visualization above looks to give people a different frame of reference to think about the country’s massive population figures.
The Population Breakdown
Similar to other big countries, the gap between India’s largest and smallest states is quite wide.
Uttar Pradesh is the most populous country subdivision in the world at 232 million people, while Sikkim, in the northeast of the country, is the least populated state in India (0.7 million).
Here are India’s 28 states and 8 union territories compared to other countries and territories with comparable sizes:
| State | Population (2022) | Country | Population (2022) |
|---|---|---|---|
| Uttar Pradesh | 232M | 🇧🇷 Brazil + 🇪🇨 Ecuador | 234M |
| Bihar | 129M | 🇲🇽 Mexico | 132M |
| Maharashtra | 125M | 🇯🇵 Japan | 126M |
| West Bengal | 101M | 🇪🇬 Egypt | 107M |
| Madhya Pradesh | 85M | 🇹🇷 Turkey | 87M |
| Tamil Nadu | 84M | 🇩🇪 Germany | 84M |
| Rajasthan | 80M | 🇺🇦 Ukraine + 🇵🇱 Poland | 81M |
| Gujarat | 70M | 🇹🇭 Thailand | 70M |
| Karnataka | 70M | 🇬🇧 UK | 69M |
| Andhra Pradesh | 54M | 🇲🇲 Myanmar | 55M |
| Odisha | 47M | 🇪🇸 Spain | 47M |
| Jharkhand | 40M | 🇮🇶 Iraq | 42M |
| Telangana | 38M | 🇲🇾 Malaysia + 🇸🇬 Singapore | 39M |
| Assam | 36M | 🇨🇦 Canada | 39M |
| Kerala | 35M | 🇸🇦 Saudi Arabia | 36M |
| Chhattisgarh | 32M | 🇵🇪 Peru | 34M |
| Punjab | 31M | 🇦🇺 Australia + 🇳🇿 New Zealand | 31M |
| Haryana | 29M | 🇻🇪 Venezuela | 28M |
| Delhi | 19M | 🇷🇴 Romania | 19M |
| Jammu and Kashmir | 15M | 🇿🇼 Zimbabwe | 15M |
| Uttarakhand | 12M | 🇧🇴 Bolivia | 12M |
| Himachal Pradesh | 7.5M | 🇭🇰 Hong Kong | 7.6M |
| Tripura | 4.2M | 🇭🇷 Croatia | 4.0M |
| Meghalaya | 3.8M | 🇪🇷 Eritrea | 3.7M |
| Manipur | 3.4M | 🇺🇾 Uruguay | 3.5M |
| Nagaland | 2.1M | 🇸🇮 Slovenia | 2.1M |
| Puducherry | 1.6M | 🇧🇭 Bahrain | 1.8M |
| Arunachal Pradesh | 1.7M | 🇱🇻 Latvia | 1.8M |
| Goa | 1.5M | 🇬🇶 Equatorial Guinea | 1.5M |
| Mizoram | 1.3M | 🇪🇪 Estonia | 1.3M |
| Chandigarh | 1.2M | 🇨🇾 Cyprus | 1.3M |
| Dadra and Nagar Haveli & Daman and Diu | 0.8M | 🇬🇾 Guyana | 0.8M |
| Sikkim | 0.7M | 🇲🇴 Macao | 0.7M |
| Andaman & Nicobar Islands | 0.4M | 🇧🇸 Bahamas | 0.4M |
| Lakshadweep | 0.07M | 🇰🇾 Cayman Islands | 0.07M |
Hypothetically, if India’s states were to all became countries today, they would take up half the spots in a ranking of the world’s top 20 most populous countries.
A number of Indian states match up evenly against some very large countries, including Maharashtra (Japan), West Bengal (Egypt), and Tamil Nadu (Germany). Of course, the largest is Uttar Pradesh (Brazil+Chile), which also happens to measure up to neighboring Pakistan.
For people living in countries such as Canada or Australia, it may be humbling to know that these countries are equal to a smallish Indian state.
The Big Get Bigger
According to United Nations projections, India is on track to become the most populous country in the world in 2023.
The population of India’s growth is fueled by several factors, including declining mortality rates, increased life expectancy, and high birth rates. While India’s population growth has slowed in recent years due to factors such as urbanization and increasing access to contraception, the country’s population is still expected to continue growing at a significant rate for the foreseeable future.
Where does this data come from?
Source: Population projections for India are from indiacensus.net. Population figures for comparison countries are from the UN’s World Population Prospects: The 2019 Revision (medium-fertility variant), accessed via Worldometers‘ live tracker. All population figures shown are 2022 projections.
Data note: Because there are only so many countries, the populations of comparison countries may not perfectly match that of the various Indian states and union territories. Numbers are rounded.
Map note: A number of borders and regions in India are disputed with other countries. Our depiction of borders is a good faith, apolitical attempt at reflecting the “de facto” situation in each region.


Demographics
The Countries That Have Become Sadder Since 2010
Tracking Gallup survey data for more than a decade reveals some countries are witnessing big happiness declines, reflecting their shifting socio-economic conditions.


The Countries That Have Become Sadder Since 2010
This was originally posted on our Voronoi app. Download the app for free on iOS or Android and discover incredible data-driven charts from a variety of trusted sources.
Can happiness be quantified?
Some approaches that try to answer this question make a distinction between two differing components of happiness: a daily experience part, and a more general life evaluation (which includes how people think about their life as a whole).
The World Happiness Report—first launched in 2012—has been making a serious go at quantifying happiness, by examining Gallup poll data that asks respondents in nearly every country to evaluate their life on a 0–10 scale. From this they extrapolate a single “happiness score” out of 10 to compare how happy (or unhappy) countries are.
More than a decade later, the 2024 World Happiness Report continues the mission. Its latest findings also include how some countries have become sadder in the intervening years.
Which Countries Have Become Unhappier Since 2010?
Afghanistan is the unhappiest country in the world right now, and is also 60% unhappier than over a decade ago, indicating how much life has worsened since 2010.
In 2021, the Taliban officially returned to power in Afghanistan, after nearly two decades of American occupation in the country. The Islamic fundamentalist group has made life harder, especially for women, who are restricted from pursuing higher education, travel, and work.
On a broader scale, the Afghan economy has suffered post-Taliban takeover, with various consequent effects: mass unemployment, a drop in income, malnutrition, and a crumbling healthcare system.
| Rank | Country | Happiness Score Loss (2010–24) | 2024 Happiness Score (out of 10) |
|---|---|---|---|
| 1 | 🇦🇫 Afghanistan | -2.6 | 1.7 |
| 2 | 🇱🇧 Lebanon | -2.3 | 2.7 |
| 3 | 🇯🇴 Jordan | -1.5 | 4.2 |
| 4 | 🇻🇪 Venezuela | -1.3 | 5.6 |
| 5 | 🇲🇼 Malawi | -1.2 | 3.4 |
| 6 | 🇿🇲 Zambia | -1.2 | 3.5 |
| 7 | 🇧🇼 Botswana | -1.2 | 3.4 |
| 8 | 🇾🇪 Yemen | -1.0 | 3.6 |
| 9 | 🇪🇬 Egypt | -1.0 | 4.0 |
| 10 | 🇮🇳 India | -0.9 | 4.1 |
| 11 | 🇧🇩 Bangladesh | -0.9 | 3.9 |
| 12 | 🇨🇩 DRC | -0.7 | 3.3 |
| 13 | 🇹🇳 Tunisia | -0.7 | 4.4 |
| 14 | 🇨🇦 Canada | -0.6 | 6.9 |
| 15 | 🇺🇸 U.S. | -0.6 | 6.7 |
| 16 | 🇨🇴 Colombia | -0.5 | 5.7 |
| 17 | 🇵🇦 Panama | -0.5 | 6.4 |
| 18 | 🇵🇰 Pakistan | -0.5 | 4.7 |
| 19 | 🇿🇼 Zimbabwe | -0.5 | 3.3 |
| 20 | 🇮🇪 Ireland | -0.5 | 6.8 |
| N/A | 🌍 World | +0.1 | 5.5 |
Nine countries in total saw their happiness score drop by a full point or more, on the 0–10 scale.
Noticeably, many of them have seen years of social and economic upheaval. Lebanon, for example, has been grappling with decades of corruption, and a severe liquidity crisis since 2019 that has resulted in a banking system collapse, sending poverty levels skyrocketing.
In Jordan, unprecedented population growth—from refugees leaving Iraq and Syria—has aggravated unemployment rates. A somewhat abrupt change in the line of succession has also raised concerns about political stability in the country.

-

 Mining1 week ago
Gold vs. S&P 500: Which Has Grown More Over Five Years?
-

 Markets2 weeks ago
Ranked: The Most Valuable Housing Markets in America
-

 Money2 weeks ago
Which States Have the Highest Minimum Wage in America?
-

 AI2 weeks ago
Ranked: Semiconductor Companies by Industry Revenue Share
-

 Markets2 weeks ago
Ranked: The World’s Top Flight Routes, by Revenue
-

 Demographics2 weeks ago
Population Projections: The World’s 6 Largest Countries in 2075
-

 Markets2 weeks ago
The Top 10 States by Real GDP Growth in 2023
-

 Demographics2 weeks ago
The Smallest Gender Wage Gaps in OECD Countries