Technology
The Podcasting Boom Explained
The Podcasting Boom Explained in One Infographic
The impact of technology on how we consume information cannot be understated.
The most seismic shift has been to the media landscape as platforms like Facebook overtake traditional channels of news, distribution, and advertising. Not only does this put incumbent news conglomerates in an unenviable position, but it has also thrust tech companies into the reluctant role of the gatekeeper for society’s most important news and information.
While people may be divided on whether this is good or bad, there is another major change stemming from technology that is more clean cut in having a positive effect on consumers. The internet has allowed the news and content we consume to migrate away from centralized and capital-intensive sources (radio shows, cable TV), opening up many new and digestible formats of storytelling that were never before imaginable.
The barrier of entry for content has dropped towards zero, and it allows for many different “laboratories” to test new ideas, formats, and concepts until the winners are found.
New Formats to Experience
We are obviously advocates of the growing role of the visual medium for storytelling, which we aim to do mainly through infographics and data visualizations. While people have used visual storytelling since the cave drawing days, technology has really allowed this medium to hit a new stride as a way to break through the clutter. Further, science says that people crave visual content, and infographics provide a shareable, intuitive, distilled, and thought-provoking approach to sharing data.
Like infographics, the podcasting format – which is the subject of today’s post from Concordia University – has also recently began hitting a sweet spot for audiences around the world. This convenient audio format has been made possible through technology, and doesn’t rely on the same entrenched distribution channels as old school formats, such as radio.
As a result, podcasters can experiment more with the structures of their craft, while avoiding traditional forms of censorship. Today’s podcasts are breaking new ground daily with unique content that falls anywhere on the spectrum, from improvisational comedy to fact-dense educational features.
The Podcasting Boom
The podcast, a name originating from a portmanteau of “iPod” and “broadcast”, was first coined in 2004 by journalist Ben Hammersley of the BBC and The Guardian.
Despite being a feasible form of content even during the age of MP3 players and early broadband connections, the format has only really hit the mainstream in recent years. It’s hard to explain why, but most experts point to increased mobility, better production value, and a group of content creators that have recently managed to capture the imagination of the broader public.
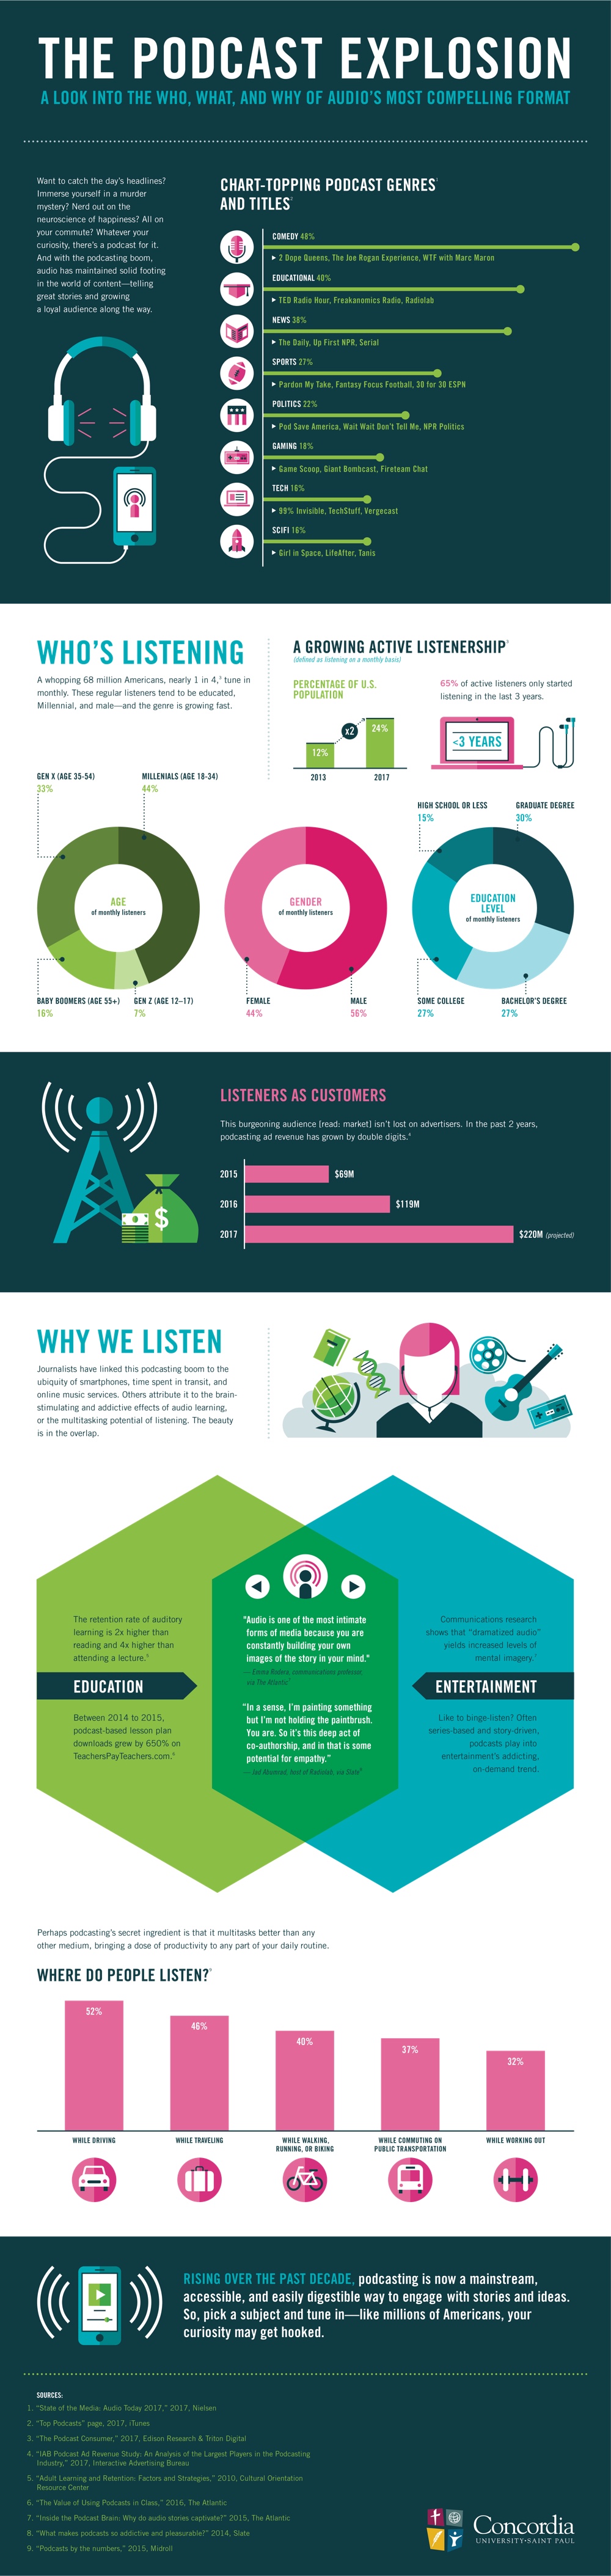
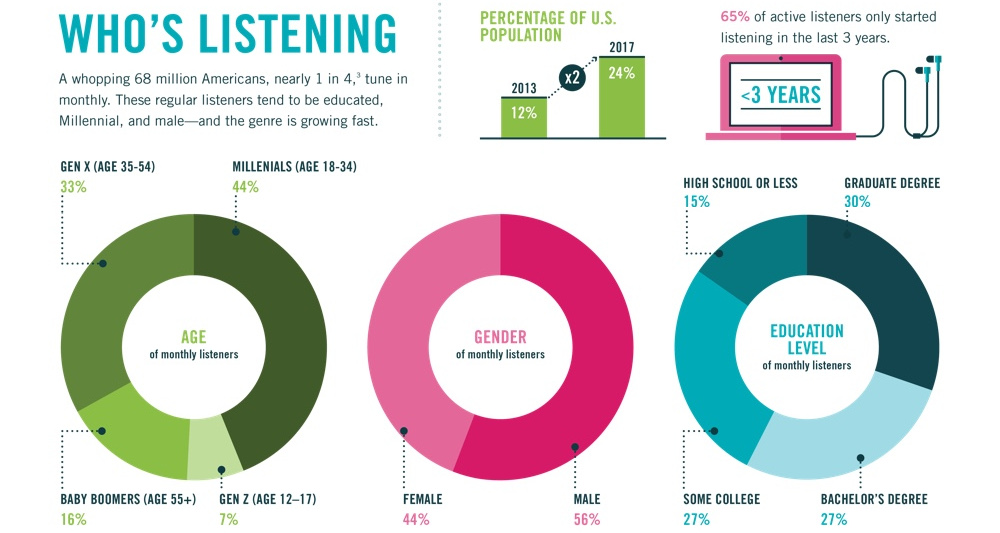
Regardless, in recent years, the podcasting space has boomed to new levels of popularity. Today, the percentage of Americans that listen to podcasts is 24%, which is double what it was in 2013.
Further, the advertising market for podcasts is growing as well. In 2015, the ad market for podcasts was $69 million – but by 2017, the market was triple the size at an estimated $220 million. Podcasts allow advertisers to tap into very specific audience psychographics, and podcasts offer higher CPMs ($25-45) for successful publishers than traditional online content ($1-$20).
When and Where?
Aside from allowing new types of content to blossom outside of traditional distribution channels, podcasting has one other defining characteristic: mobility.
Just as streaming does for video, podcasts allow audio to be played in many situations where it was previously less feasible for a user to curate content. In fact, people listen to podcasts the most while driving (52%), traveling (46%), walking, running, or biking (40%), commuting on public transportation (37%), and while working out (32%).
This carves a pretty interesting niche that video and other content types can’t fill. And if podcasting content keeps getting better, people may even opt to listen in at other times outside of travel, building out the medium to even bigger heights.


Technology
All of the Grants Given by the U.S. CHIPS Act
Intel, TSMC, and more have received billions in subsidies from the U.S. CHIPS Act in 2024.


All of the Grants Given by the U.S. CHIPS Act
This was originally posted on our Voronoi app. Download the app for free on iOS or Android and discover incredible data-driven charts from a variety of trusted sources.
This visualization shows which companies are receiving grants from the U.S. CHIPS Act, as of April 25, 2024. The CHIPS Act is a federal statute signed into law by President Joe Biden that authorizes $280 billion in new funding to boost domestic research and manufacturing of semiconductors.
The grant amounts visualized in this graphic are intended to accelerate the production of semiconductor fabrication plants (fabs) across the United States.
Data and Company Highlights
The figures we used to create this graphic were collected from a variety of public news sources. The Semiconductor Industry Association (SIA) also maintains a tracker for CHIPS Act recipients, though at the time of writing it does not have the latest details for Micron.
| Company | Federal Grant Amount | Anticipated Investment From Company |
|---|---|---|
| 🇺🇸 Intel | $8,500,000,000 | $100,000,000,000 |
| 🇹🇼 TSMC | $6,600,000,000 | $65,000,000,000 |
| 🇰🇷 Samsung | $6,400,000,000 | $45,000,000,000 |
| 🇺🇸 Micron | $6,100,000,000 | $50,000,000,000 |
| 🇺🇸 GlobalFoundries | $1,500,000,000 | $12,000,000,000 |
| 🇺🇸 Microchip | $162,000,000 | N/A |
| 🇬🇧 BAE Systems | $35,000,000 | N/A |
BAE Systems was not included in the graphic due to size limitations
Intel’s Massive Plans
Intel is receiving the largest share of the pie, with $8.5 billion in grants (plus an additional $11 billion in government loans). This grant accounts for 22% of the CHIPS Act’s total subsidies for chip production.
From Intel’s side, the company is expected to invest $100 billion to construct new fabs in Arizona and Ohio, while modernizing and/or expanding existing fabs in Oregon and New Mexico. Intel could also claim another $25 billion in credits through the U.S. Treasury Department’s Investment Tax Credit.
TSMC Expands its U.S. Presence
TSMC, the world’s largest semiconductor foundry company, is receiving a hefty $6.6 billion to construct a new chip plant with three fabs in Arizona. The Taiwanese chipmaker is expected to invest $65 billion into the project.
The plant’s first fab will be up and running in the first half of 2025, leveraging 4 nm (nanometer) technology. According to TrendForce, the other fabs will produce chips on more advanced 3 nm and 2 nm processes.
The Latest Grant Goes to Micron
Micron, the only U.S.-based manufacturer of memory chips, is set to receive $6.1 billion in grants to support its plans of investing $50 billion through 2030. This investment will be used to construct new fabs in Idaho and New York.

-

 Debt1 week ago
How Debt-to-GDP Ratios Have Changed Since 2000
-

 Countries2 weeks ago
Population Projections: The World’s 6 Largest Countries in 2075
-

 Markets2 weeks ago
The Top 10 States by Real GDP Growth in 2023
-

 Demographics2 weeks ago
The Smallest Gender Wage Gaps in OECD Countries
-

 United States2 weeks ago
Where U.S. Inflation Hit the Hardest in March 2024
-

 Green2 weeks ago
Top Countries By Forest Growth Since 2001
-

 United States2 weeks ago
Ranked: The Largest U.S. Corporations by Number of Employees
-

 Maps2 weeks ago
The Largest Earthquakes in the New York Area (1970-2024)