Mapped: Europe’s GDP Per Capita, by Country
The Growth of a $1,000 Equity Investment, by Stock Market
Mapped: The Most Valuable Company in Each Southeast Asian Country
Visualizing Global Inflation Forecasts (2024-2026)
The World’s Fastest Growing Emerging Markets (2024-2029 Forecast)
Countries With the Highest Rates of Crypto Ownership
Mapped: The Number of AI Startups By Country
All of the Grants Given by the U.S. CHIPS Act
Visualizing AI Patents by Country
How Tech Logos Have Evolved Over Time
Visualizing the Tax Burden of Every U.S. State
Charted: What Frustrates Americans About the Tax System
Ranked: The Top 20 Countries in Debt to China
Charted: Which Country Has the Most Billionaires in 2024?
Charted: Which City Has the Most Billionaires in 2024?
Which Countries Have the Highest Infant Mortality Rates?
Life Expectancy by Region (1950-2050F)
What Causes Preventable Child Deaths?
The Cost of an EpiPen in Major Markets
Charted: Global Tobacco Use by Country and Sex
Who’s Building the Most Solar Energy?
Mapped: The Age of Energy Projects in Interconnection Queues, by State
Ranked: The Top 10 EV Battery Manufacturers in 2023
The World’s Biggest Nuclear Energy Producers
The World’s Biggest Oil Producers in 2023
Mapped: U.S. Immigrants by Region
Mapped: Southeast Asia’s GDP Per Capita, by Country
The Largest Earthquakes in the New York Area (1970-2024)
Mapped: Average Wages Across Europe
Mapped: Asia’s Population Patterns by Density
Visualizing Copper Production by Country in 2023
Where the World’s Aluminum is Smelted, by Country
Visualizing Global Gold Production in 2023
Gold vs. S&P 500: Which Has Grown More Over Five Years?
How People Get Around in America, Europe, and Asia
The Carbon Footprint of Major Travel Methods
Ranking the Top 15 Countries by Carbon Tax Revenue
Ranked: The Countries With the Most Air Pollution in 2023
Top Countries By Forest Growth Since 2001
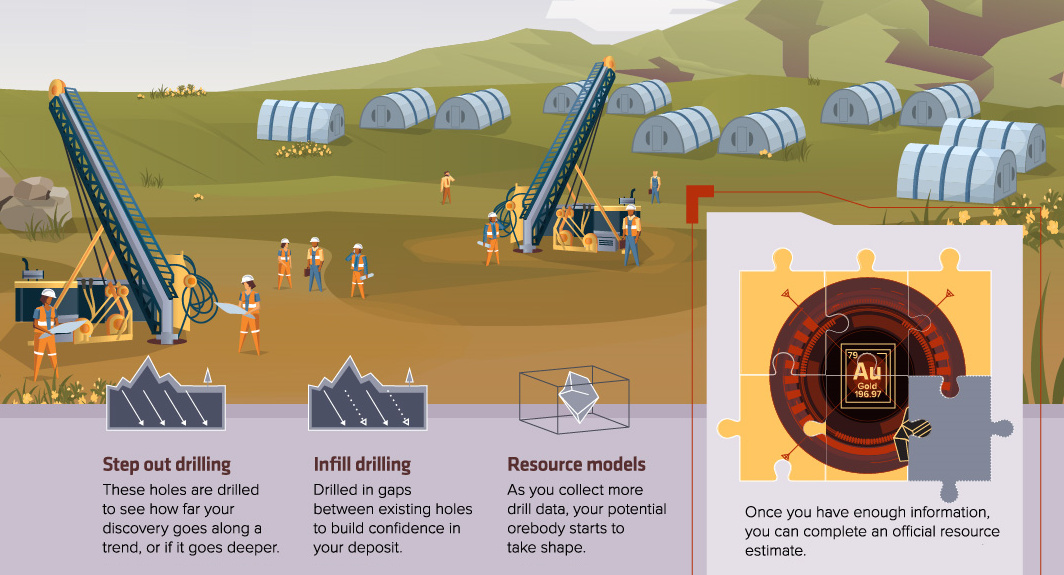
Finding a new deposit is tough, but here's how to better your odds. This infographic shows the steps of mineral exploration, from prospecting to production.
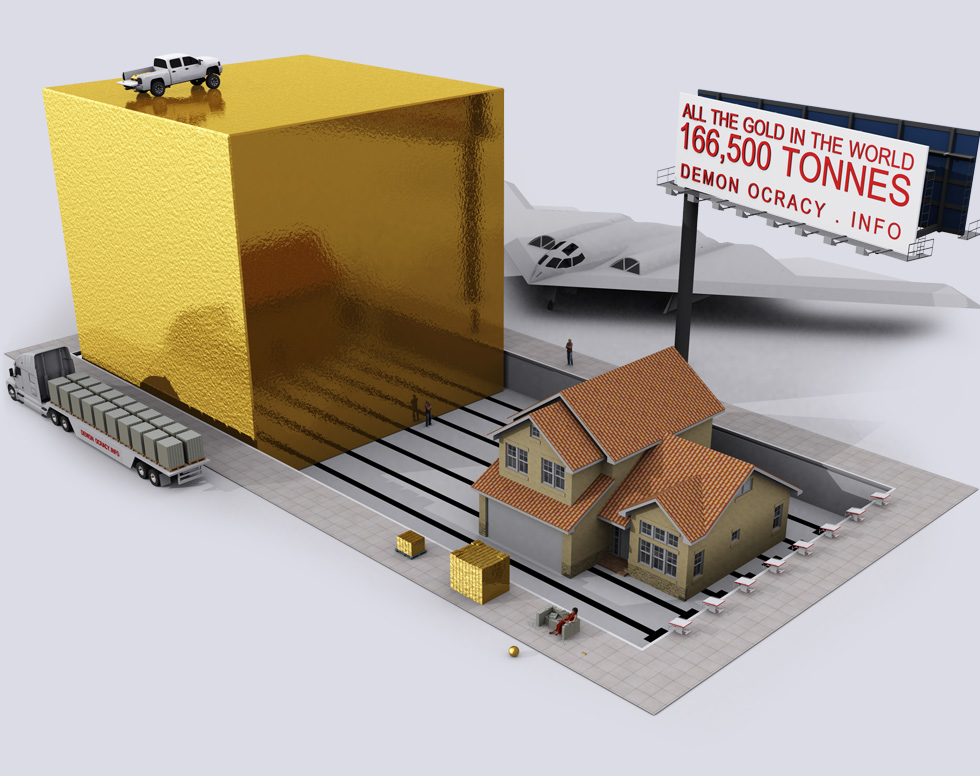
How rare is gold? This set of 3D visualizations show the world's gold in bullion bars.
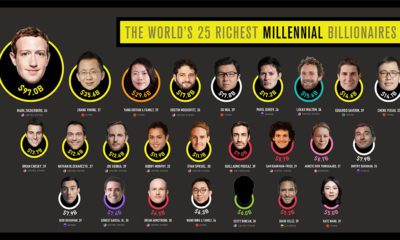
There are over 2,700 billionaires in the world, but how many are millennials? This visual breaks down the richest millennial billionaires.
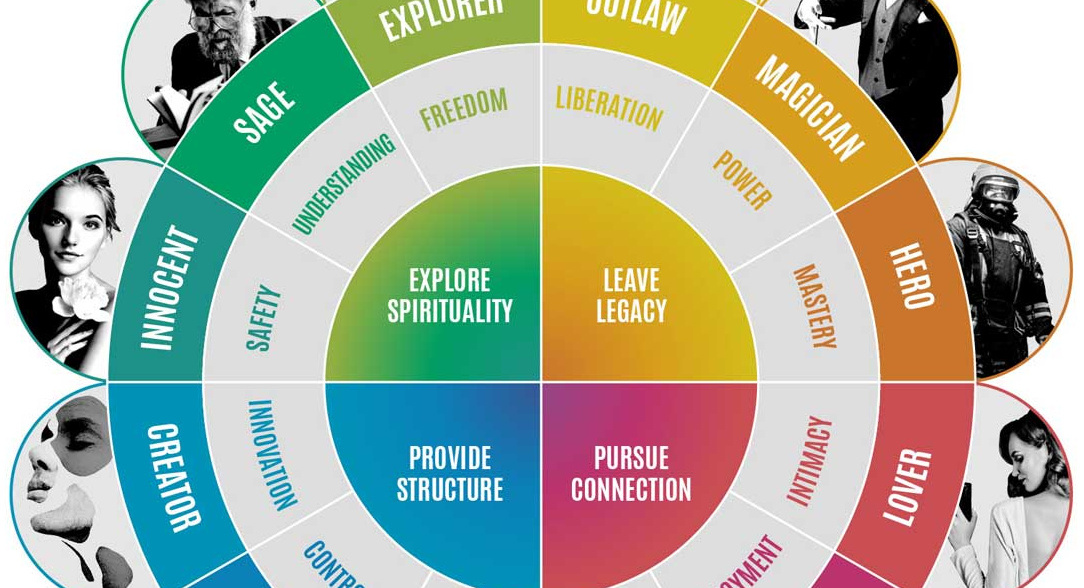
We're bombarded with 5,000+ ads per day, but we don't ignore all of them. Here are the brand archetypes marketers use to communicate their stories to...
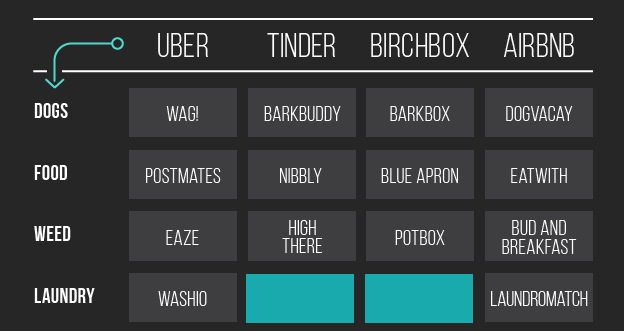
Got the next big startup idea, such as the 'Tinder for Pizza'? See if it's taken in this handy, tongue-in-cheek infographic.
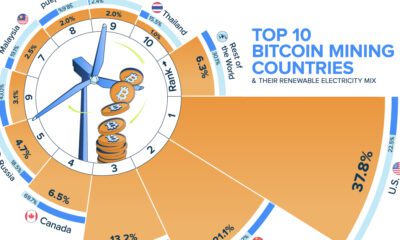
Bitcoin miners worldwide use about 348 TWh of electricity per year, as much as some countries, but just where does all that power come from?
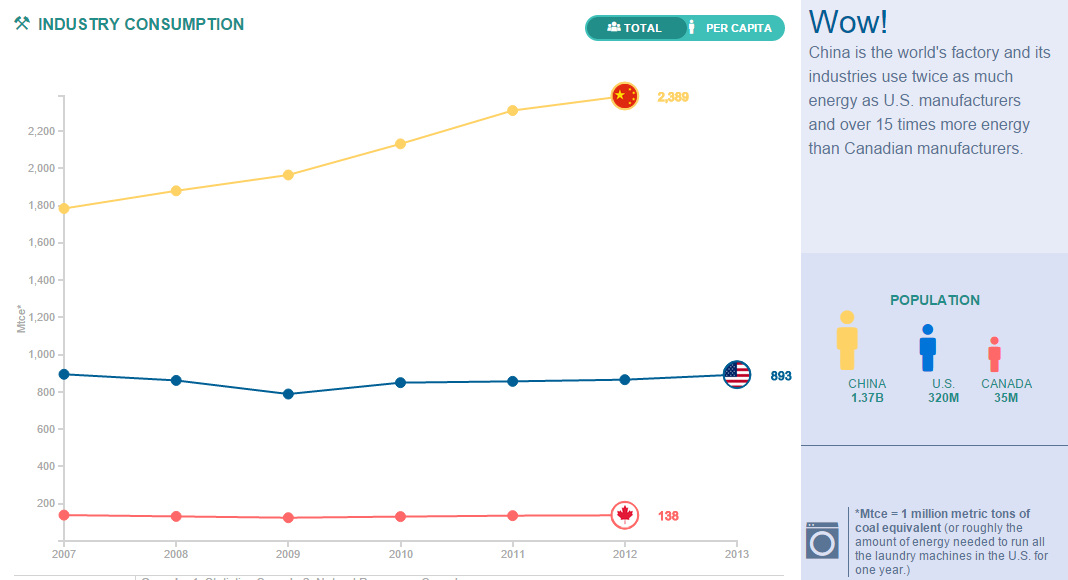
Compare the United States, China, and Canada side-by-side to see the differences in how these energy titans consume, produce, and import/export energy.
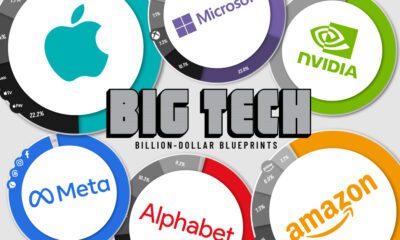
Thanks to the ubiquity of their products and services, these Big Tech companies have revenues bigger than many national GDPs.
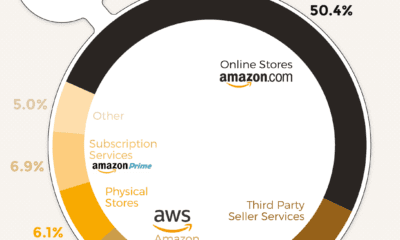
In 2019, Amazon generated $281 billion in total revenue—but where does all this revenue come from? Here’s a breakdown of how Amazon makes its money.
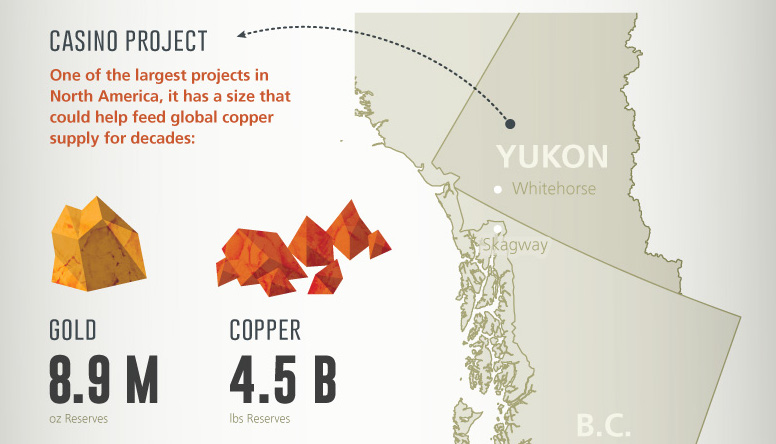
This company snapshot infographic highlights Western Copper and Gold, a company developing Canada's premiere copper and gold mine.