Visualizing Global Inflation Forecasts (2024-2026)
The World’s Fastest Growing Emerging Markets (2024-2029 Forecast)
The Most Valuable Companies in Major EU Economies
Visualized: Interest Rate Forecasts for Advanced Economies
The Best U.S. Companies to Work for According to LinkedIn
All of the Grants Given by the U.S. CHIPS Act
Visualizing AI Patents by Country
How Tech Logos Have Evolved Over Time
Ranked: Semiconductor Companies by Industry Revenue Share
The Stock Performance of U.S. Chipmakers So Far in 2024
Ranked: The Top 20 Countries in Debt to China
Charted: Which Country Has the Most Billionaires in 2024?
Charted: Which City Has the Most Billionaires in 2024?
Charted: Who Has Savings in This Economy?
How Debt-to-GDP Ratios Have Changed Since 2000
What Causes Preventable Child Deaths?
The Cost of an EpiPen in Major Markets
Charted: Global Tobacco Use by Country and Sex
Visualized: What Lives in Your Gut Microbiome?
Charted: Average Years Left to Live by Age
Mapped: The Age of Energy Projects in Interconnection Queues, by State
Ranked: The Top 10 EV Battery Manufacturers in 2023
The World’s Biggest Nuclear Energy Producers
The World’s Biggest Oil Producers in 2023
How Much Does the U.S. Depend on Russian Uranium?
The Largest Earthquakes in the New York Area (1970-2024)
Mapped: Average Wages Across Europe
Mapped: Asia’s Population Patterns by Density
A Map of Global Happiness By Country in 2024
Mapped: Population Growth by Region (1900-2050F)
Visualizing Global Gold Production in 2023
Gold vs. S&P 500: Which Has Grown More Over Five Years?
Charted: The Value Gap Between the Gold Price and Gold Miners
Charted: Global Uranium Reserves, by Country
The Carbon Footprint of Major Travel Methods
Ranking the Top 15 Countries by Carbon Tax Revenue
Ranked: The Countries With the Most Air Pollution in 2023
Top Countries By Forest Growth Since 2001
Ranked: Top Countries by Total Forest Loss Since 2001
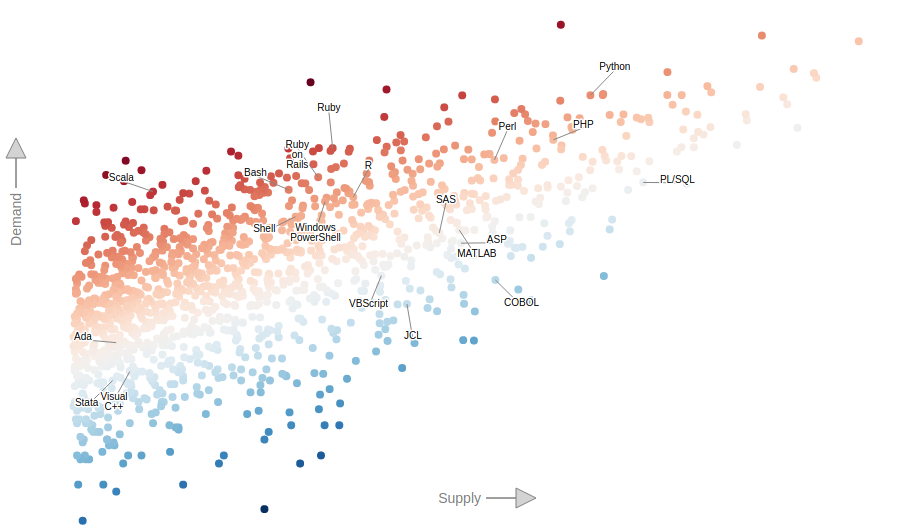
The Most Valuable Tech Skills The interactive graphic above comes to us from Dice Insights, and it helps to visualize the relationship between the supply and...
...49.0 Ad Dammam Saudi Arabia 48.5 Olomouc Czech Republic 48.2 Kosice Slovakia 48.2 Kuwait City Kuwait 48.0 San Jose Costa Rica 47.7 Coimbra Portugal 47.4 Abidjan...
...Google that is quantifying everything you do – pretty much every website is tracking you in some shape or form. Here’s what you need to know,...
The Advertising Revolution Sponsored by: Market One Media Group Many decades ago, the world was much simpler for advertisers. Buying a ½ page newspaper ad or...
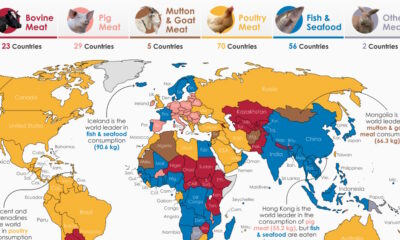
Mapped: Meat Consumption By Country and Type Meat is always on the menu in many parts of the world, as we can see when we map...
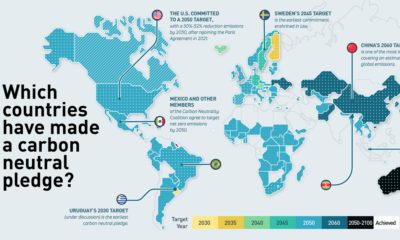
Race to Net Zero: Carbon Neutral Goals by Country The time to talk about net zero goals is running out, and the time to put them...
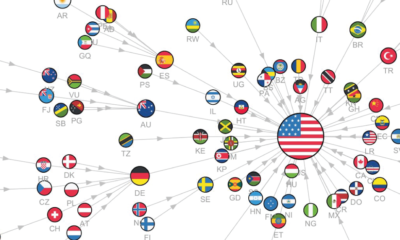
...for Canada, Mexico and India in America. https://www.youtube.com/watch?v=rdE7T_4uTKY The searches for Mexico seem to be concentrated in the Western U.S., which is also where a large...
...evolution of European map borders starting from 400 BC. Empires rise and fall, invasions sweep across the continent, and modern countries slowly begin to take shape...
...0.85% 28 Somalia 163,093 0.76% 29 Dem. Rep. Congo 162,174 0.75% 30 Iran 145,177 0.67% 31 Iraq 140,365 0.65% 32 Angola 135,627 0.63% 33 Sweden 121,673...
...which has been prepared for incoming U.S. administrations since 1997. Publishing date: May 5 (Get VC+ to access) “Generational Power Index 2021: VC+ Bonus Material” SPECIAL...


 Creator Program