Visualizing Global Inflation Forecasts (2024-2026)
The World’s Fastest Growing Emerging Markets (2024-2029 Forecast)
The Most Valuable Companies in Major EU Economies
Visualized: Interest Rate Forecasts for Advanced Economies
The Best U.S. Companies to Work for According to LinkedIn
All of the Grants Given by the U.S. CHIPS Act
Visualizing AI Patents by Country
How Tech Logos Have Evolved Over Time
Ranked: Semiconductor Companies by Industry Revenue Share
The Stock Performance of U.S. Chipmakers So Far in 2024
Ranked: The Top 20 Countries in Debt to China
Charted: Which Country Has the Most Billionaires in 2024?
Charted: Which City Has the Most Billionaires in 2024?
Charted: Who Has Savings in This Economy?
How Debt-to-GDP Ratios Have Changed Since 2000
What Causes Preventable Child Deaths?
The Cost of an EpiPen in Major Markets
Charted: Global Tobacco Use by Country and Sex
Visualized: What Lives in Your Gut Microbiome?
Charted: Average Years Left to Live by Age
Mapped: The Age of Energy Projects in Interconnection Queues, by State
Ranked: The Top 10 EV Battery Manufacturers in 2023
The World’s Biggest Nuclear Energy Producers
The World’s Biggest Oil Producers in 2023
How Much Does the U.S. Depend on Russian Uranium?
The Largest Earthquakes in the New York Area (1970-2024)
Mapped: Average Wages Across Europe
Mapped: Asia’s Population Patterns by Density
A Map of Global Happiness By Country in 2024
Mapped: Population Growth by Region (1900-2050F)
Visualizing Global Gold Production in 2023
Gold vs. S&P 500: Which Has Grown More Over Five Years?
Charted: The Value Gap Between the Gold Price and Gold Miners
Charted: Global Uranium Reserves, by Country
The Carbon Footprint of Major Travel Methods
Ranking the Top 15 Countries by Carbon Tax Revenue
Ranked: The Countries With the Most Air Pollution in 2023
Top Countries By Forest Growth Since 2001
Ranked: Top Countries by Total Forest Loss Since 2001
...Google that is quantifying everything you do – pretty much every website is tracking you in some shape or form. Here’s what you need to know,...
...turn the city into a shipping powerhouse, and there was a building boom on the horizon. Cholera epidemics, fires, and riots swept through the city at...
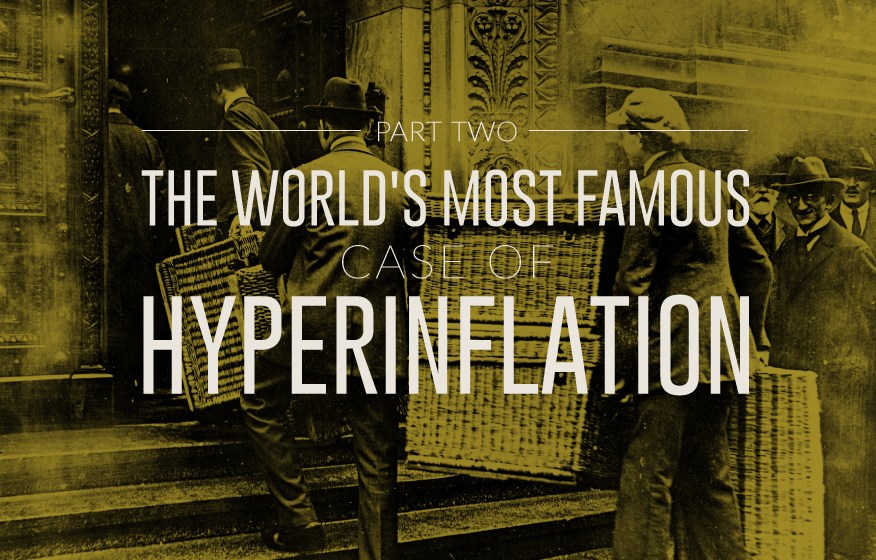
...an inflation rate of 41.9 quintillion percent. By July 1946, the 1931 gold pengõ was worth 130 trillion paper pengõs. Peak Inflation Rates: Germany (1923): 3.5...
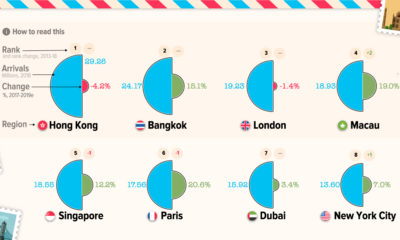
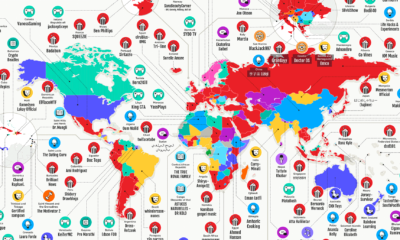
The 100 Most Popular City Destinations The pandemic has grounded many of us, but it can’t curb human wanderlust. Cities like Hong Kong, Bangkok, and London...
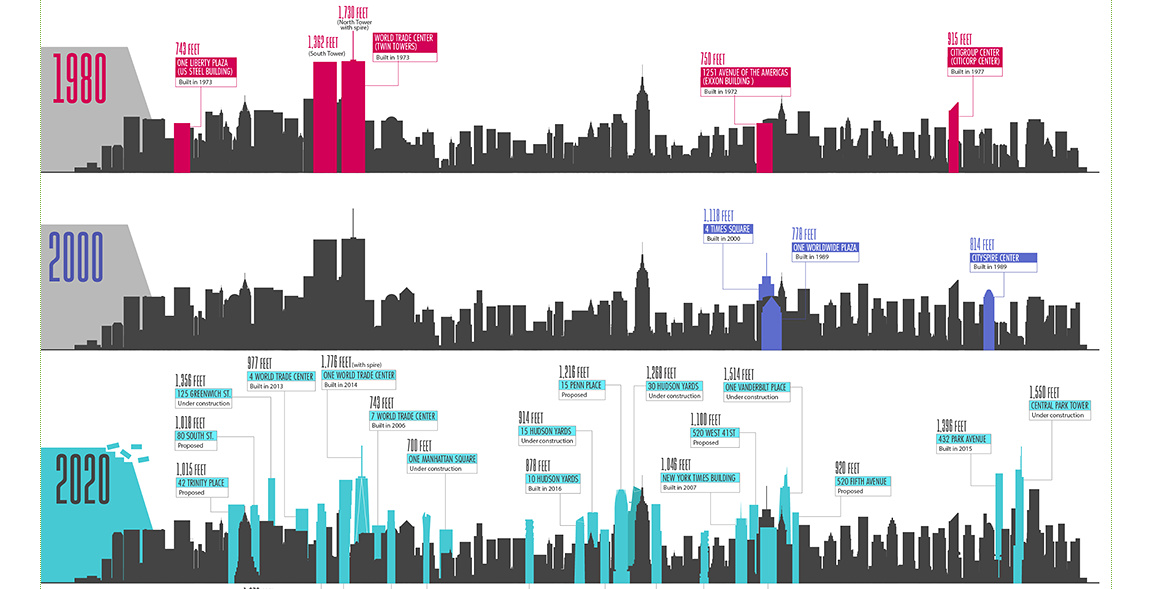
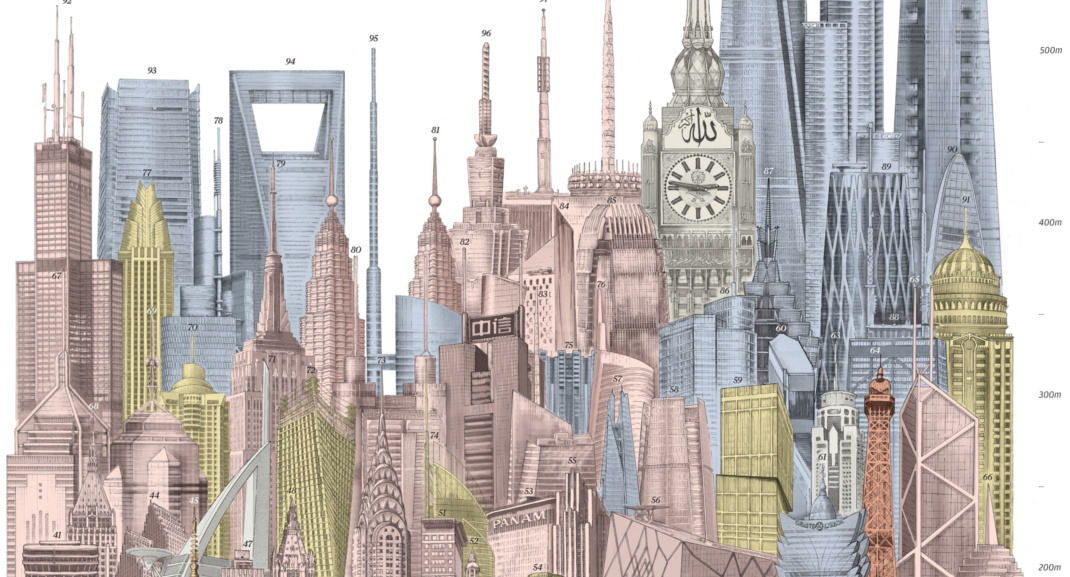
A Century of New York City’s Evolving Skyline View the high resolution version of today’s graphic by clicking here. Over New York City’s storied history, the...
...Oum Walid How To 7,470,000 $217,700 🇹🇱 Timor Leste king_vieira OFFICIAL Music 7,300 $221 🇮🇶 Iraq قناة منوعات الكوميدية العراقيه People & Blogs 7,260,000 $593,000 🇦🇿...
...res / hotel / retail 111 West 57th Street New York City 435.3 2019 residential One Vanderbilt New York City 427 2021 office 30 Hudson Yards...
...which has been prepared for incoming U.S. administrations since 1997. Publishing date: May 5 (Get VC+ to access) “Generational Power Index 2021: VC+ Bonus Material” SPECIAL...
...of this week, we’re offering a bonus gift from the Visual Capitalist team! BONUS GIFT Back us now and receive ‘Our All-Time Greatest Visualizations’. Everyone who...
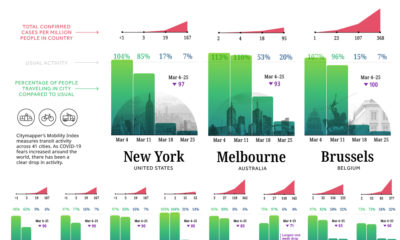
...4% -96% #9 Los Angeles 🇺🇸 USA 108% 81% 23% 13% -95% #10 Melbourne 🇦🇺 Australia 113% 110% 53% 20% -93% *Note: Data measures the %...