Mapped: Europe’s GDP Per Capita, by Country
The Growth of a $1,000 Equity Investment, by Stock Market
Mapped: The Most Valuable Company in Each Southeast Asian Country
Visualizing Global Inflation Forecasts (2024-2026)
The World’s Fastest Growing Emerging Markets (2024-2029 Forecast)
Countries With the Highest Rates of Crypto Ownership
Mapped: The Number of AI Startups By Country
All of the Grants Given by the U.S. CHIPS Act
Visualizing AI Patents by Country
How Tech Logos Have Evolved Over Time
Visualizing the Tax Burden of Every U.S. State
Charted: What Frustrates Americans About the Tax System
Ranked: The Top 20 Countries in Debt to China
Charted: Which Country Has the Most Billionaires in 2024?
Charted: Which City Has the Most Billionaires in 2024?
Life Expectancy by Region (1950-2050F)
What Causes Preventable Child Deaths?
The Cost of an EpiPen in Major Markets
Charted: Global Tobacco Use by Country and Sex
Visualized: What Lives in Your Gut Microbiome?
Who’s Building the Most Solar Energy?
Mapped: The Age of Energy Projects in Interconnection Queues, by State
Ranked: The Top 10 EV Battery Manufacturers in 2023
The World’s Biggest Nuclear Energy Producers
The World’s Biggest Oil Producers in 2023
The Largest Earthquakes in the New York Area (1970-2024)
Mapped: Average Wages Across Europe
Mapped: Asia’s Population Patterns by Density
A Map of Global Happiness By Country in 2024
Mapped: Population Growth by Region (1900-2050F)
Where the World’s Aluminum is Smelted, by Country
Visualizing Global Gold Production in 2023
Gold vs. S&P 500: Which Has Grown More Over Five Years?
Charted: The Value Gap Between the Gold Price and Gold Miners
The Carbon Footprint of Major Travel Methods
Ranking the Top 15 Countries by Carbon Tax Revenue
Ranked: The Countries With the Most Air Pollution in 2023
Top Countries By Forest Growth Since 2001
Ranked: Top Countries by Total Forest Loss Since 2001
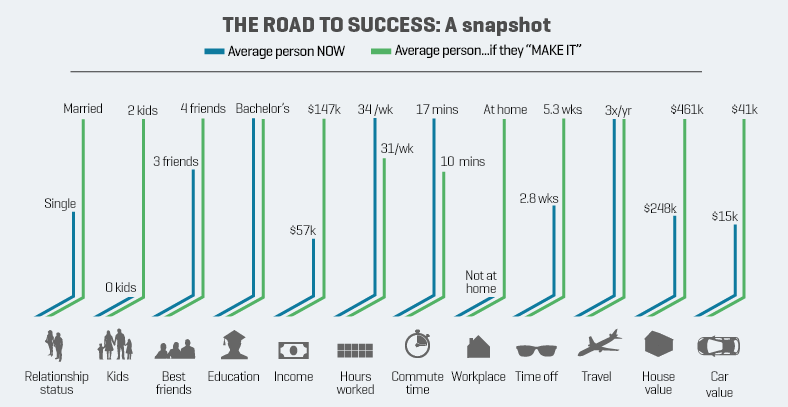
Success means different things to different people - but here's a look at what it means, on average, when people are asked to quantify success.
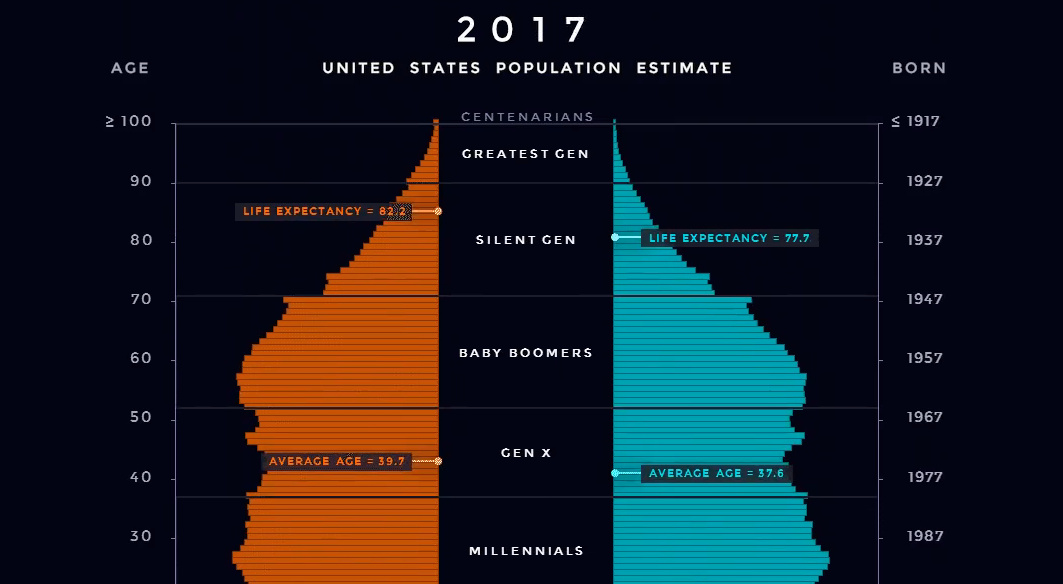
Watch the generations fly by in this animation showing the changing age composition of the U.S. population.
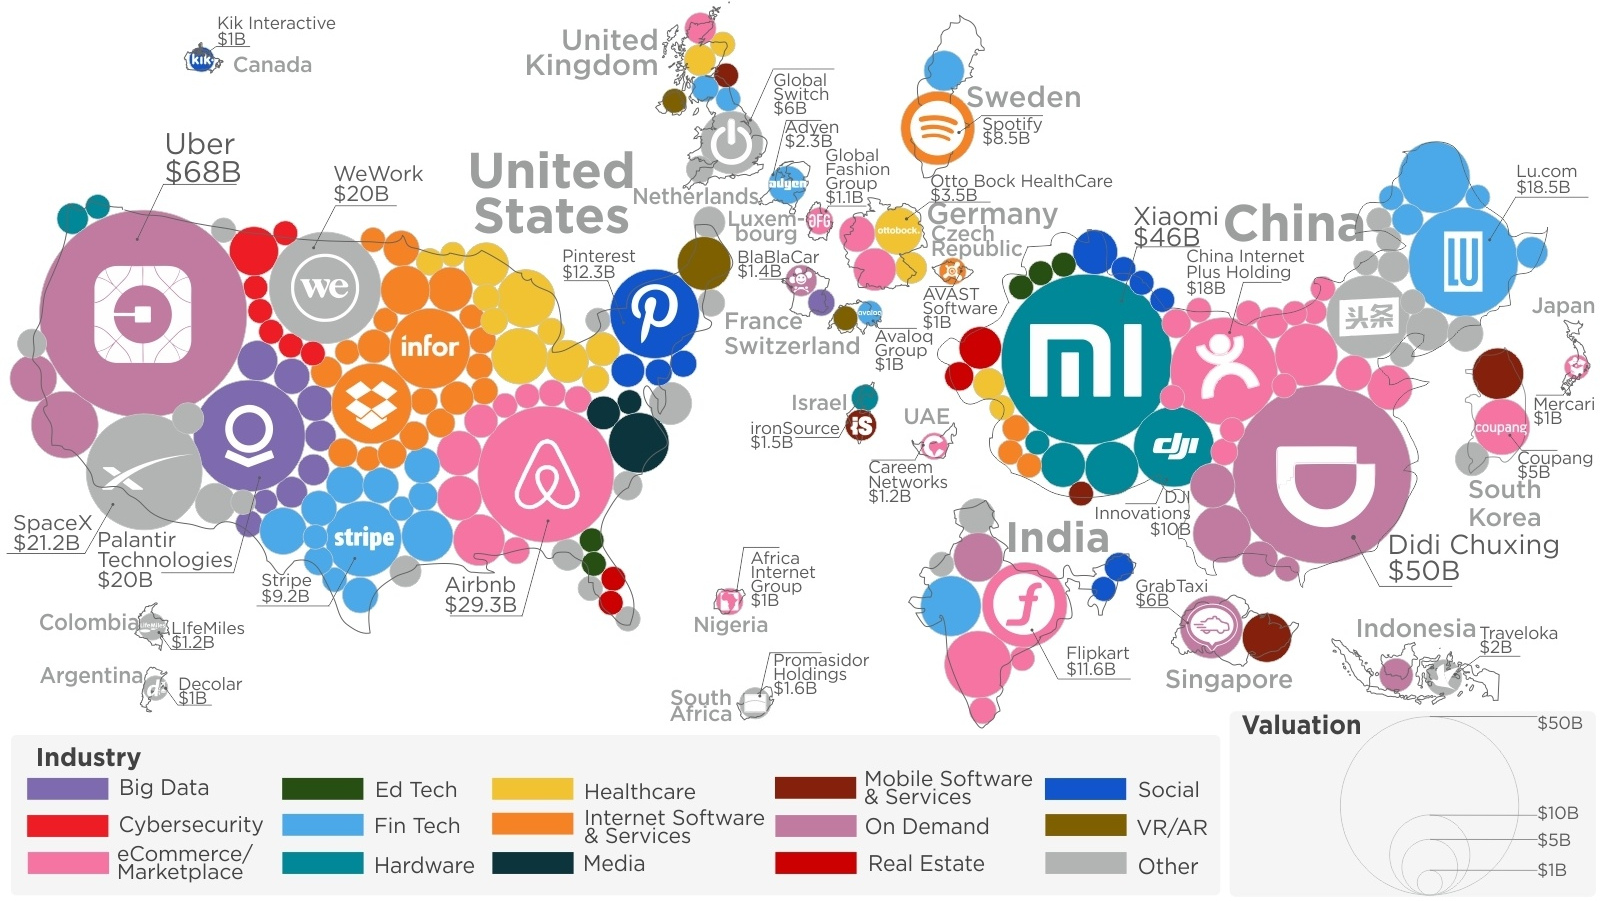
Plotting all the world's unicorns reveals two big things: extreme dominance by USA/China, as well as the disproportionate size of the Top 10 companies.
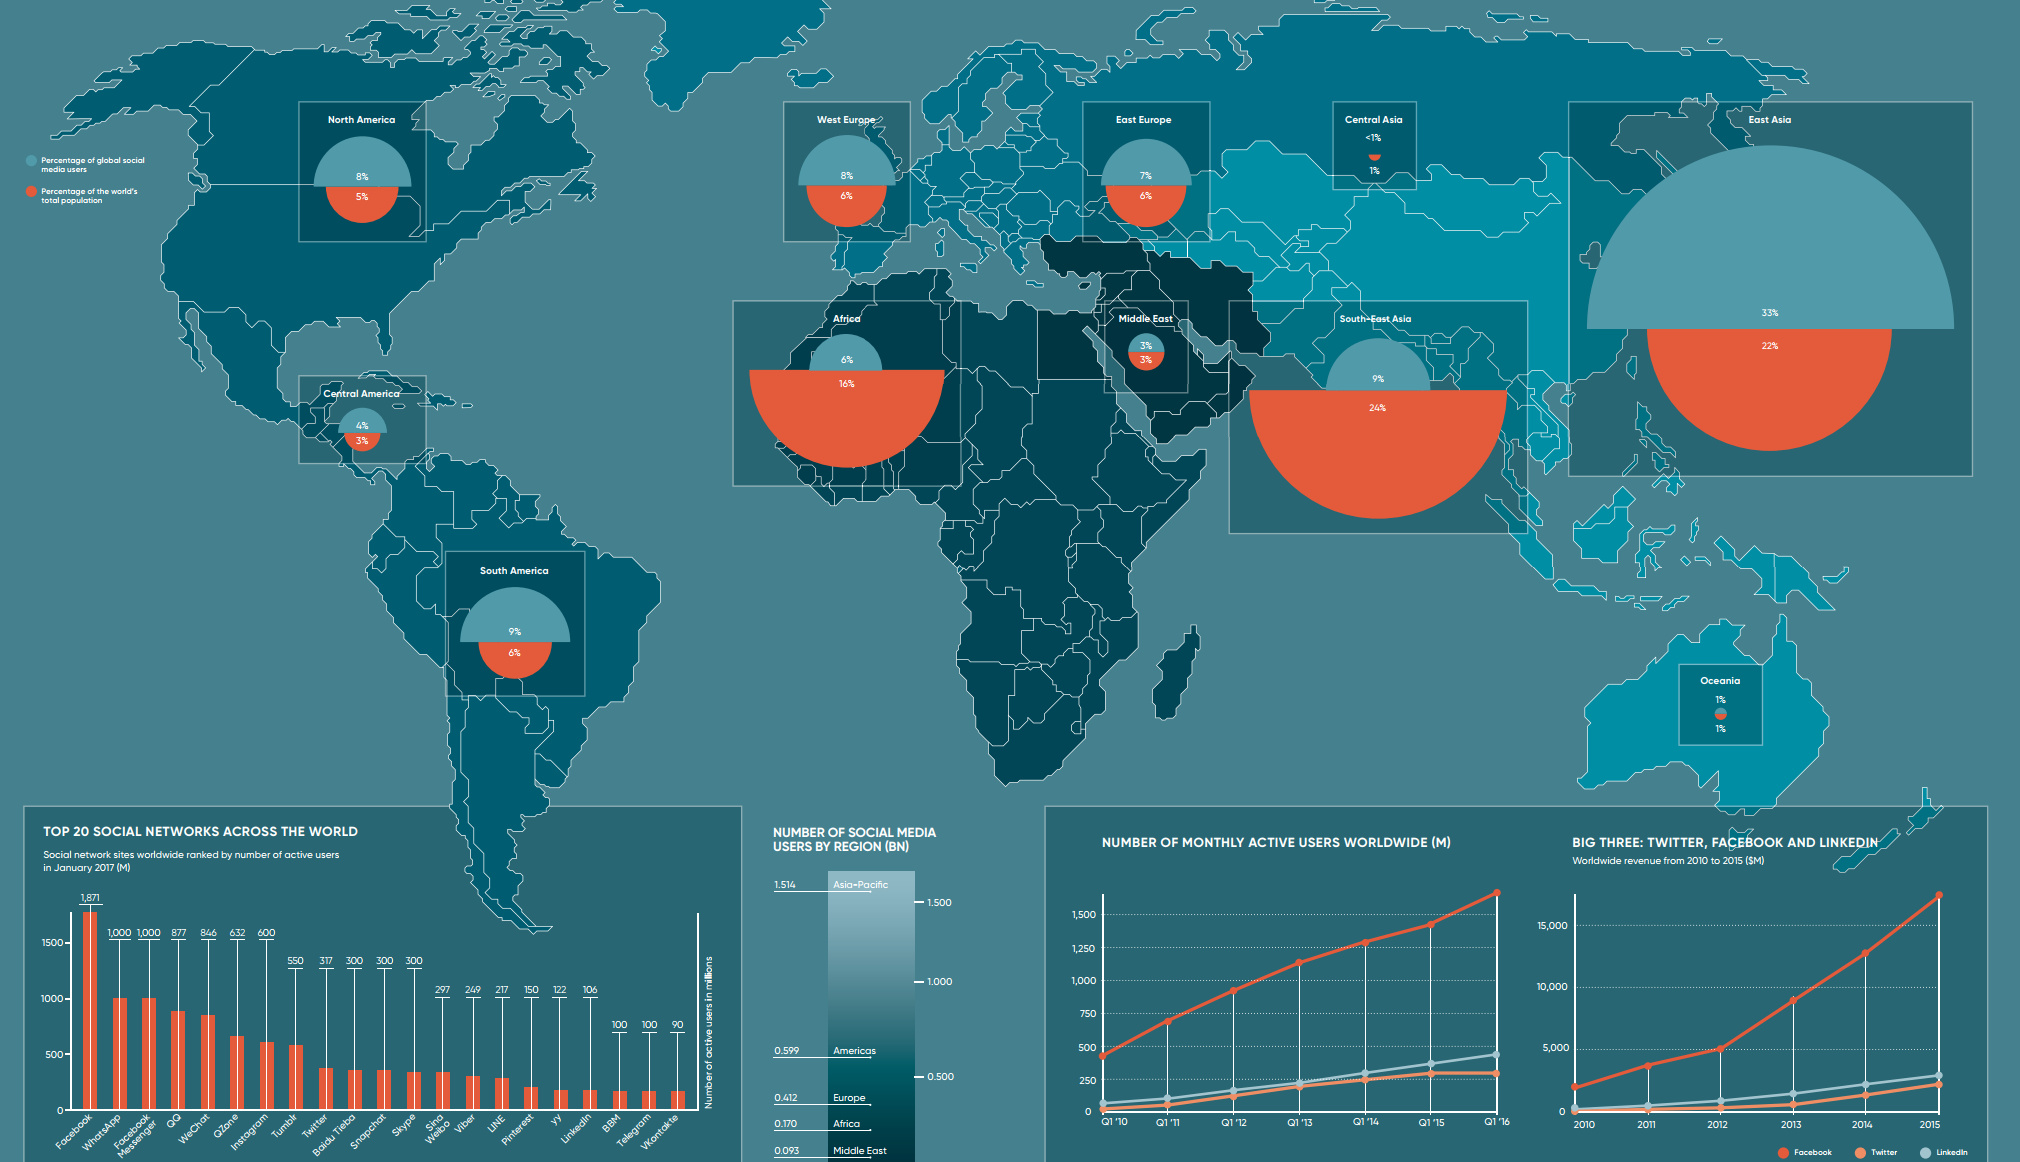
How representative is social media of actual regional geographic populations? This map compares both numbers side by side with interesting results.
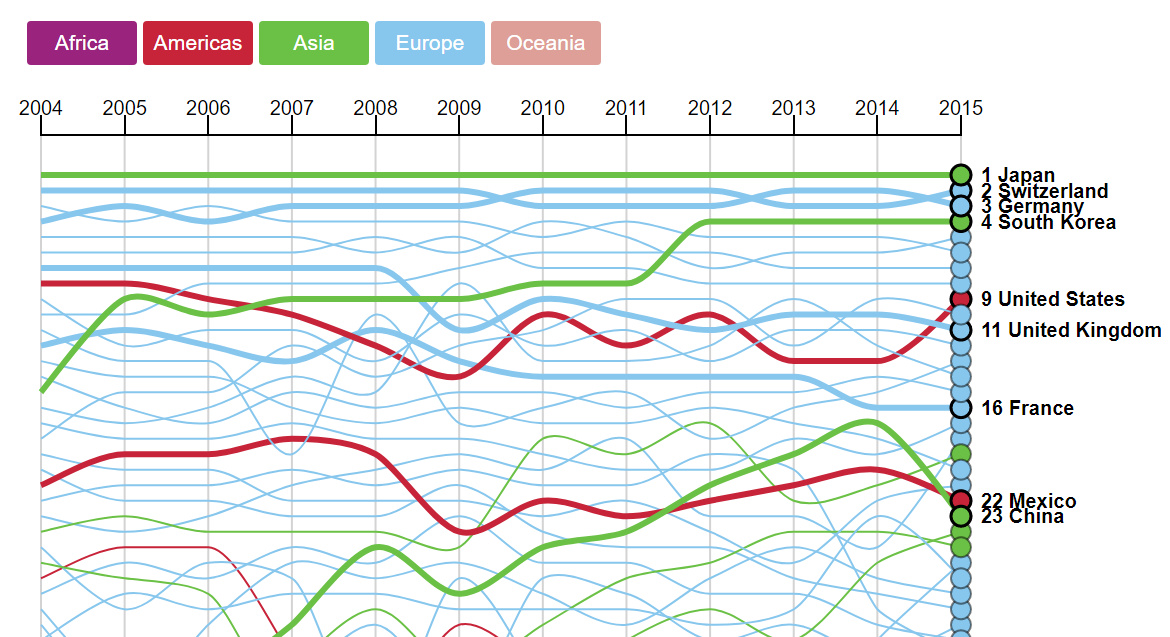
A ranking of the most sophisticated economies in the world - and also a look at the movers and shakers in terms of economic complexity.
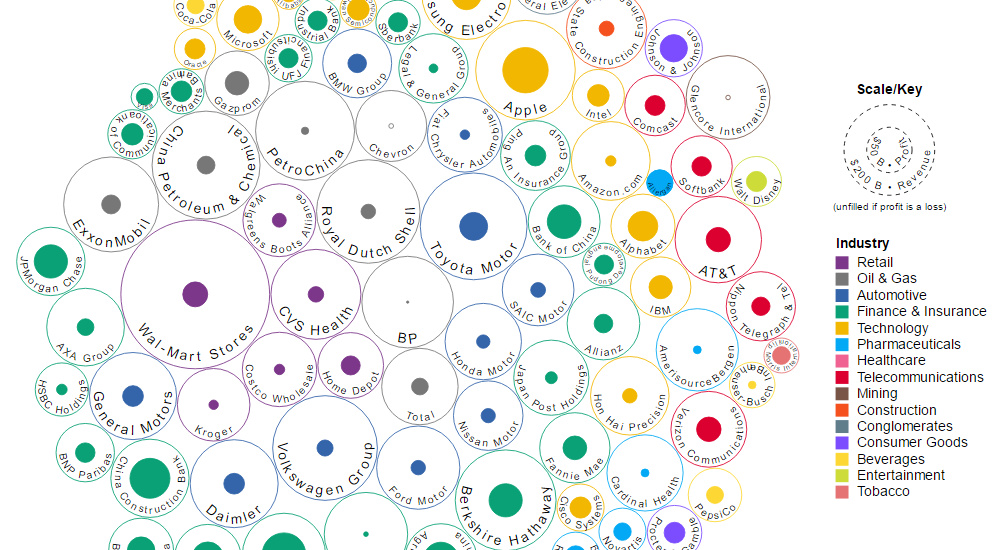
This data visualization compares the revenue and profit numbers for the top 100 companies by market valuation in the world.
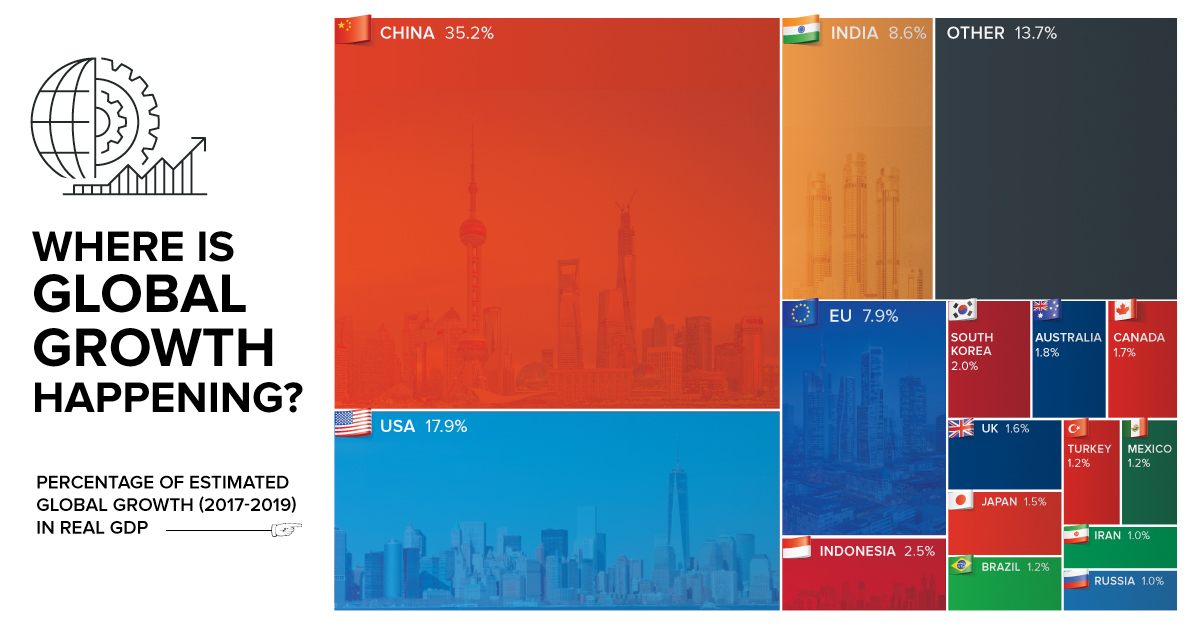
By 2019, the global economy is projected to expand another $6.5 trillion. Today's chart shows which countries will help to fuel this global growth.
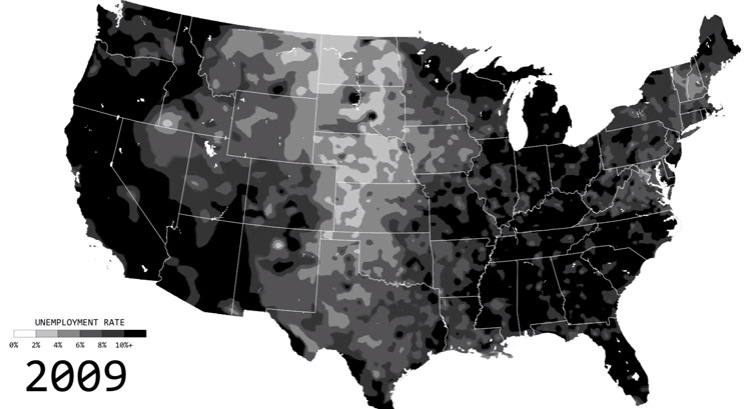
See the ebbs and flows of regional unemployment in the United States in this animated map from 1990 until 2016.
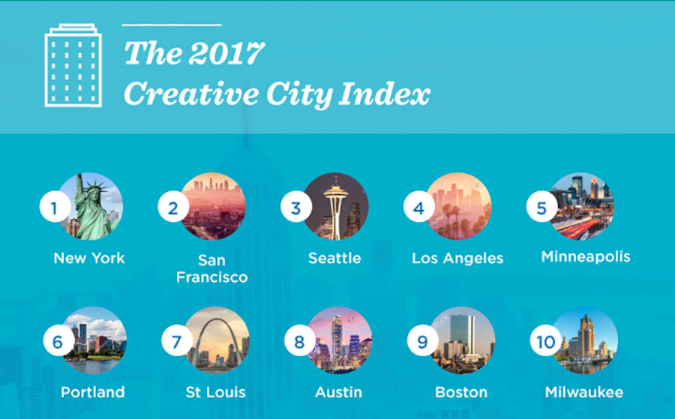
The creative economy is a vital contributor to economic health, but it's a hard thing to measure. Here are some of the most creative cities in...
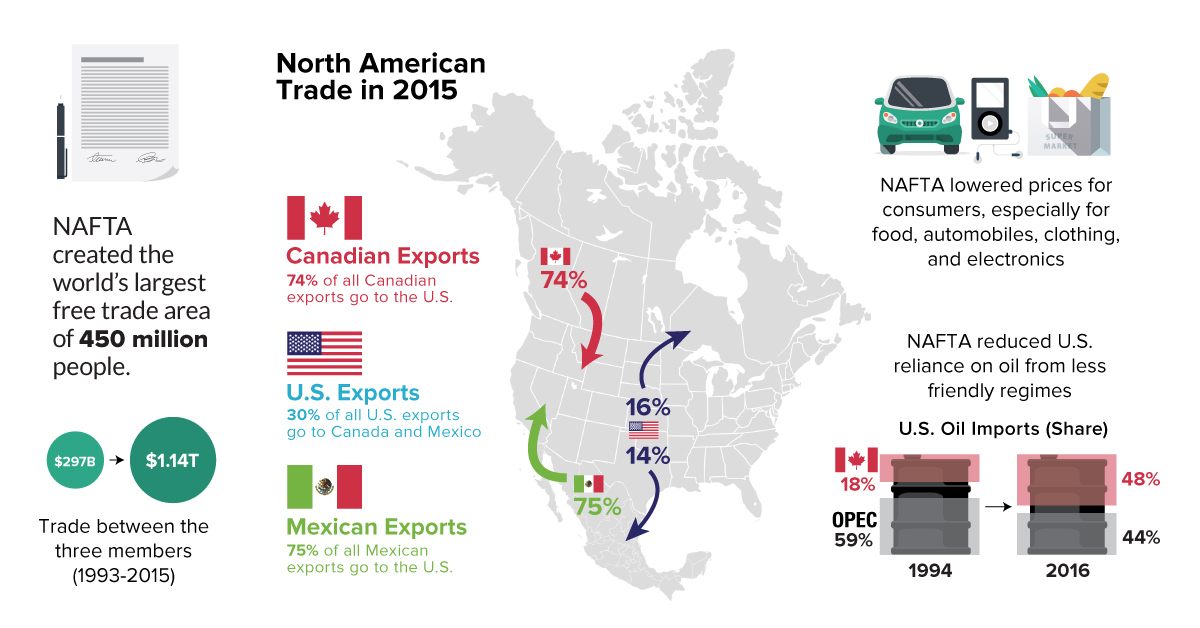
Everything you need to know about NAFTA, including a comparison of economic numbers before and since the agreement was signed in 1994.