Markets
Chart: Where is Global Growth Happening?
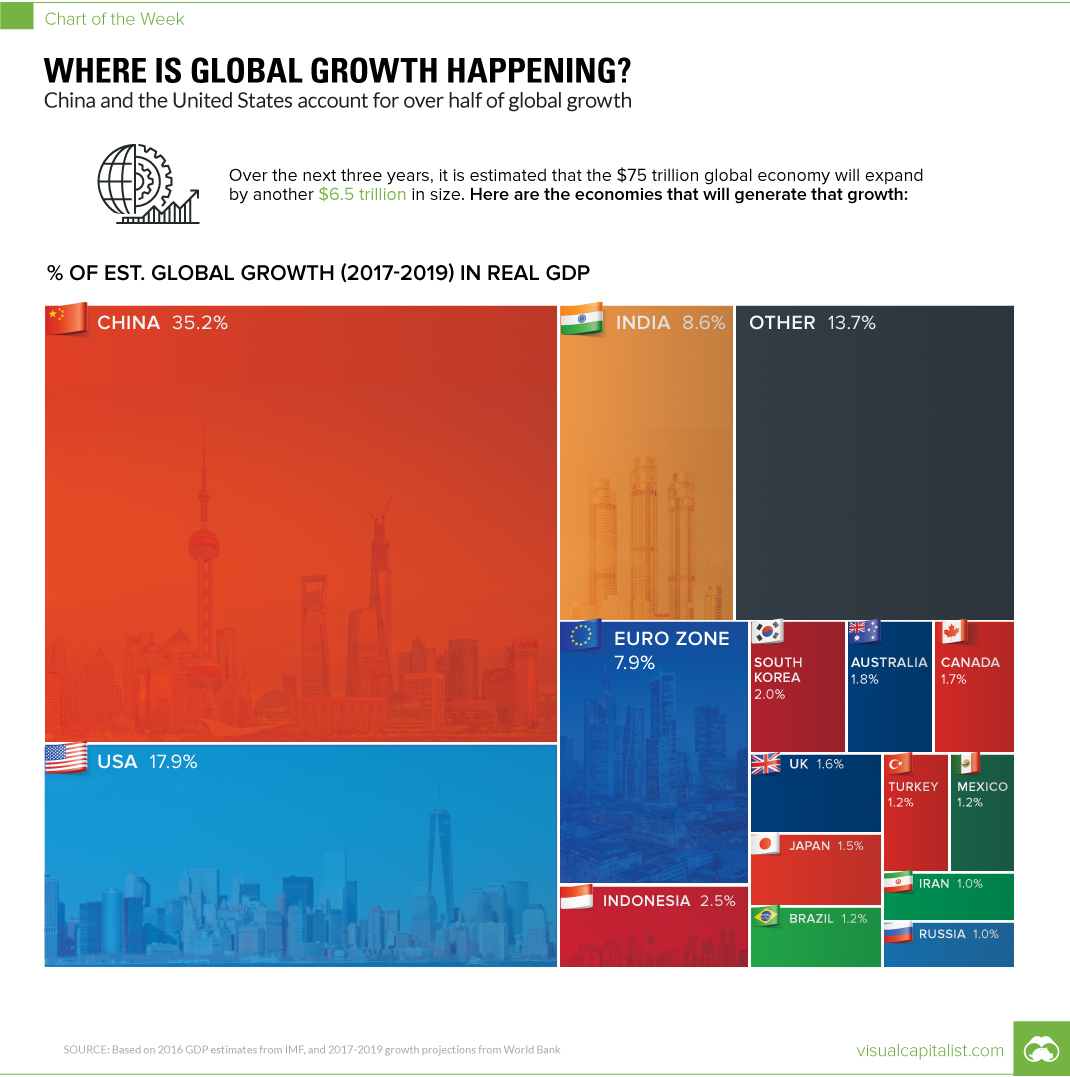
Chart: Where is Global Growth Happening?
China and U.S. still generating >50% of Real GDP growth
The Chart of the Week is a weekly Visual Capitalist feature on Fridays.
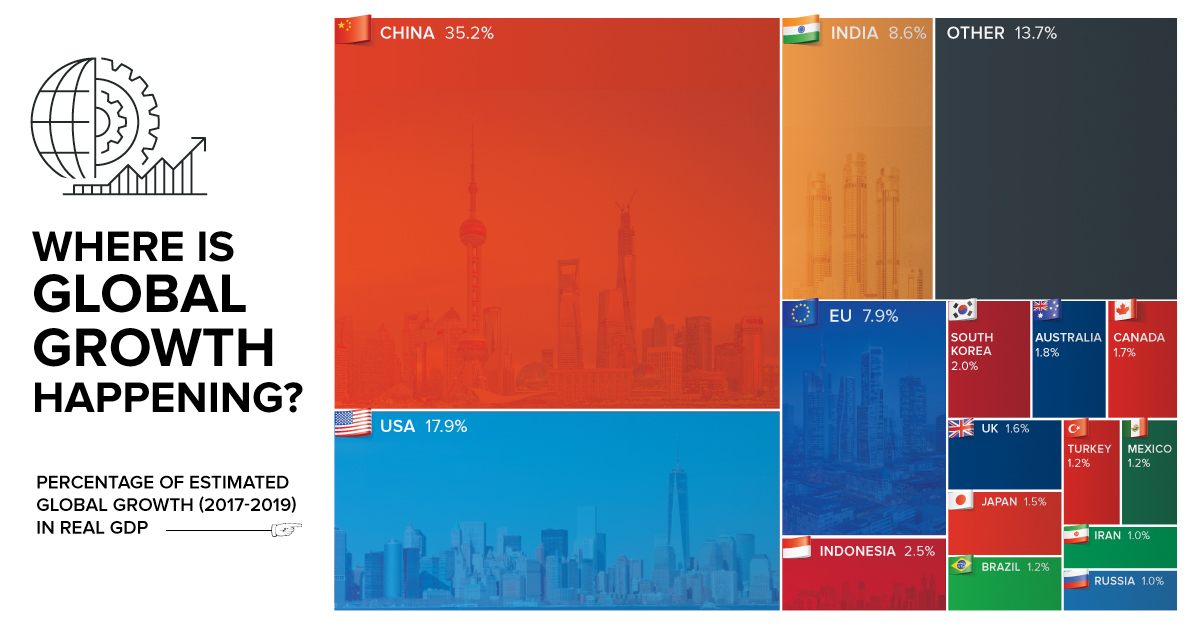
According to forecasts from earlier this year by the World Bank, the global economy is expected to average a Real GDP growth rate of 2.8% between 2017-2019.
But where will this growth actually happen? Is it in giant countries that are growing at a stable 2% clip, or is it occurring in the smaller emerging markets where 8% growth is not uncommon?
Today’s chart looks at individual countries between 2017-2019, based on their individual growth projections from the World Bank, to see where new wealth is being created.
China Still Tops
Even though growth has slowed in China somewhat, the World Bank still estimates its economy to expand at a 6.5% clip this year, and 6.3% in both 2018 and 2019.
Add these numbers onto the world’s second biggest economy (and the biggest in PPP terms), and you have an incredible amount of growth. In fact, about 35.2% of global GDP growth will come from China over this period of time, putting the country’s economic output $2.3 trillion higher.
Uncertainty in the U.S.
While the U.S. is also expected to contribute a significant portion of global growth, the World Bank had a fairly ominous caveat to their projections over coming years.
The U.S. forecasts do not incorporate the effect of policy proposals by the new U.S. administration, as their overall scope and ultimate form are still uncertain.
– World Bank, Global Outlook Summary
That said, the World Bank does also mention that the tax cuts proposed by the Trump administration could theoretically bump up U.S. and global growth if implemented. However, with all of the chaos in the current U.S. political environment, the tax cuts have been delayed for now – and some analysts are scaling back the chances of them even happening at all.
Other Growth Hotbeds
Beyond the usual suspects of China, India, the Eurozone, and the U.S., it is interesting to see Indonesia as the next biggest bright spot using this type of analysis.
In fact, the world’s fourth most populous nation will account for 2.5% of global GDP growth over the aforementioned time period, adding another $160 billion to its $941 billion GDP. The World Bank projects growth for the country at 5.3% this year, and 5.5% for the next two years.
The other countries that registered as providing 1% or more of global growth?
They include: South Korea (2.0%), Australia (1.8%), Canada (1.7%), UK (1.6%), Japan (1.5%), Brazil (1.2%), Turkey (1.2%), Mexico (1.2%), Russia (1.0%), and Iran (1.0%).
–
Correction: A previous version of the chart was incorrectly labeled “EU”. That portion of the tree map has been updated to Euro Zone.


Economy
Economic Growth Forecasts for G7 and BRICS Countries in 2024
The IMF has released its economic growth forecasts for 2024. How do the G7 and BRICS countries compare?


G7 & BRICS Real GDP Growth Forecasts for 2024
The International Monetary Fund’s (IMF) has released its real gross domestic product (GDP) growth forecasts for 2024, and while global growth is projected to stay steady at 3.2%, various major nations are seeing declining forecasts.
This chart visualizes the 2024 real GDP growth forecasts using data from the IMF’s 2024 World Economic Outlook for G7 and BRICS member nations along with Saudi Arabia, which is still considering an invitation to join the bloc.
Get the Key Insights of the IMF’s World Economic Outlook
Want a visual breakdown of the insights from the IMF’s 2024 World Economic Outlook report?
This visual is part of a special dispatch of the key takeaways exclusively for VC+ members.
Get the full dispatch of charts by signing up to VC+.
Mixed Economic Growth Prospects for Major Nations in 2024
Economic growth projections by the IMF for major nations are mixed, with the majority of G7 and BRICS countries forecasted to have slower growth in 2024 compared to 2023.
Only three BRICS-invited or member countries, Saudi Arabia, the UAE, and South Africa, have higher projected real GDP growth rates in 2024 than last year.
| Group | Country | Real GDP Growth (2023) | Real GDP Growth (2024P) |
|---|---|---|---|
| G7 | 🇺🇸 U.S. | 2.5% | 2.7% |
| G7 | 🇨🇦 Canada | 1.1% | 1.2% |
| G7 | 🇯🇵 Japan | 1.9% | 0.9% |
| G7 | 🇫🇷 France | 0.9% | 0.7% |
| G7 | 🇮🇹 Italy | 0.9% | 0.7% |
| G7 | 🇬🇧 UK | 0.1% | 0.5% |
| G7 | 🇩🇪 Germany | -0.3% | 0.2% |
| BRICS | 🇮🇳 India | 7.8% | 6.8% |
| BRICS | 🇨🇳 China | 5.2% | 4.6% |
| BRICS | 🇦🇪 UAE | 3.4% | 3.5% |
| BRICS | 🇮🇷 Iran | 4.7% | 3.3% |
| BRICS | 🇷🇺 Russia | 3.6% | 3.2% |
| BRICS | 🇪🇬 Egypt | 3.8% | 3.0% |
| BRICS-invited | 🇸🇦 Saudi Arabia | -0.8% | 2.6% |
| BRICS | 🇧🇷 Brazil | 2.9% | 2.2% |
| BRICS | 🇿🇦 South Africa | 0.6% | 0.9% |
| BRICS | 🇪🇹 Ethiopia | 7.2% | 6.2% |
| 🌍 World | 3.2% | 3.2% |
China and India are forecasted to maintain relatively high growth rates in 2024 at 4.6% and 6.8% respectively, but compared to the previous year, China is growing 0.6 percentage points slower while India is an entire percentage point slower.
On the other hand, four G7 nations are set to grow faster than last year, which includes Germany making its comeback from its negative real GDP growth of -0.3% in 2023.
Faster Growth for BRICS than G7 Nations
Despite mostly lower growth forecasts in 2024 compared to 2023, BRICS nations still have a significantly higher average growth forecast at 3.6% compared to the G7 average of 1%.
While the G7 countries’ combined GDP is around $15 trillion greater than the BRICS nations, with continued higher growth rates and the potential to add more members, BRICS looks likely to overtake the G7 in economic size within two decades.
BRICS Expansion Stutters Before October 2024 Summit
BRICS’ recent expansion has stuttered slightly, as Argentina’s newly-elected president Javier Milei declined its invitation and Saudi Arabia clarified that the country is still considering its invitation and has not joined BRICS yet.
Even with these initial growing pains, South Africa’s Foreign Minister Naledi Pandor told reporters in February that 34 different countries have submitted applications to join the growing BRICS bloc.
Any changes to the group are likely to be announced leading up to or at the 2024 BRICS summit which takes place October 22-24 in Kazan, Russia.
Get the Full Analysis of the IMF’s Outlook on VC+
This visual is part of an exclusive special dispatch for VC+ members which breaks down the key takeaways from the IMF’s 2024 World Economic Outlook.
For the full set of charts and analysis, sign up for VC+.

-

 Markets1 week ago
U.S. Debt Interest Payments Reach $1 Trillion
-

 Markets2 weeks ago
Ranked: The Most Valuable Housing Markets in America
-

 Money2 weeks ago
Which States Have the Highest Minimum Wage in America?
-

 AI2 weeks ago
Ranked: Semiconductor Companies by Industry Revenue Share
-

 Markets2 weeks ago
Ranked: The World’s Top Flight Routes, by Revenue
-

 Countries2 weeks ago
Population Projections: The World’s 6 Largest Countries in 2075
-

 Markets2 weeks ago
The Top 10 States by Real GDP Growth in 2023
-

 Money2 weeks ago
The Smallest Gender Wage Gaps in OECD Countries