Technology
This Map Compares the Population of the Real World vs. Social Media
Explore the high resolution version of this graphic
This Map Compares the Population of the Real World vs. Social Media
View the high resolution version of today’s graphic by clicking here.
When you log on to Twitter or LinkedIn, it feels like you are connected to everyone on Earth.
Whether you want to get a taste of culture from other continents, or you want to stay on top of the latest opportunities and events in far flung places – social media allows you to connect with anyone with similar interests, no matter where they are located.
But how representative is the social media world of the real population, exactly? Today’s infographic from Raconteur breaks it all down.
Quantifying the Social World
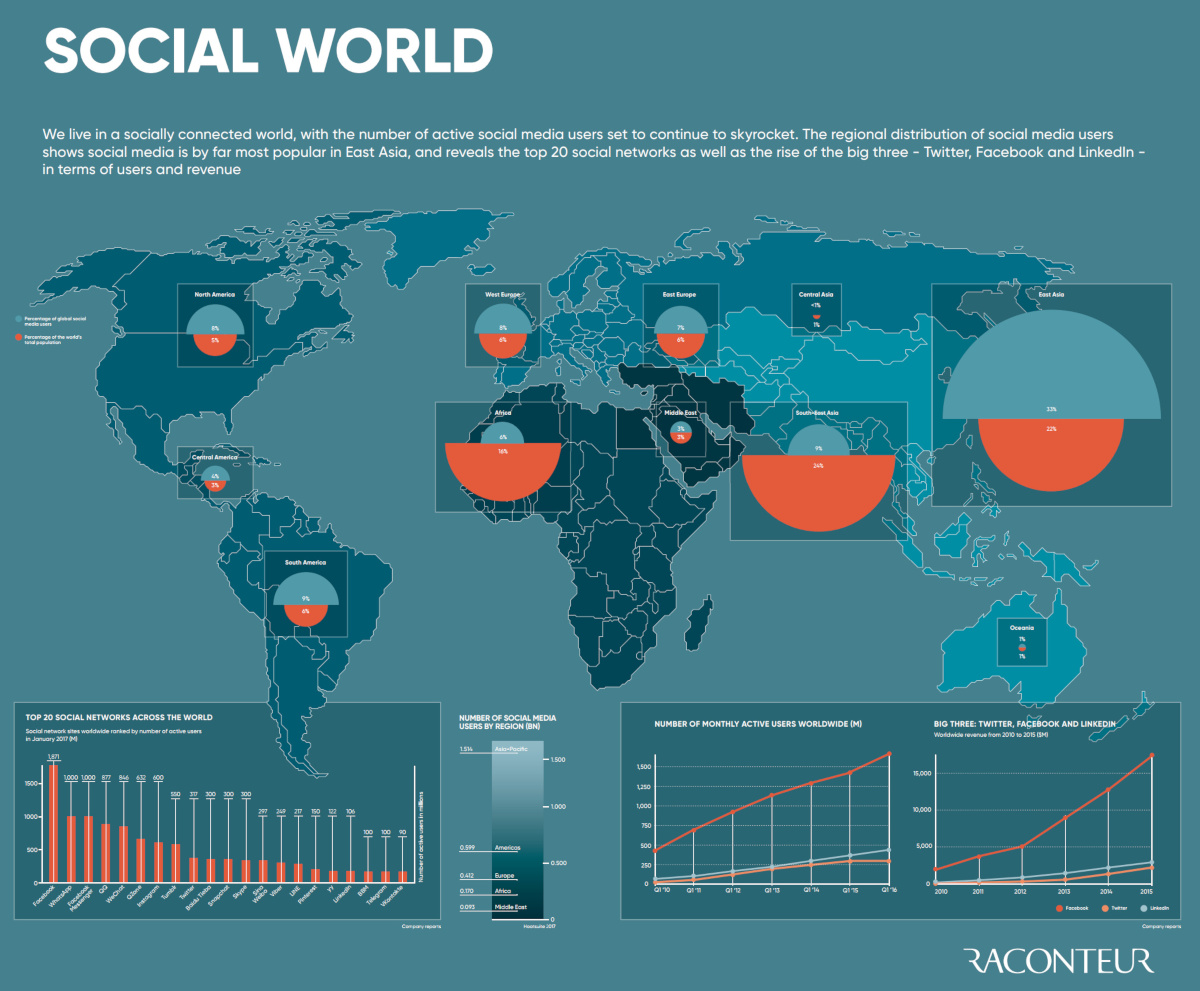
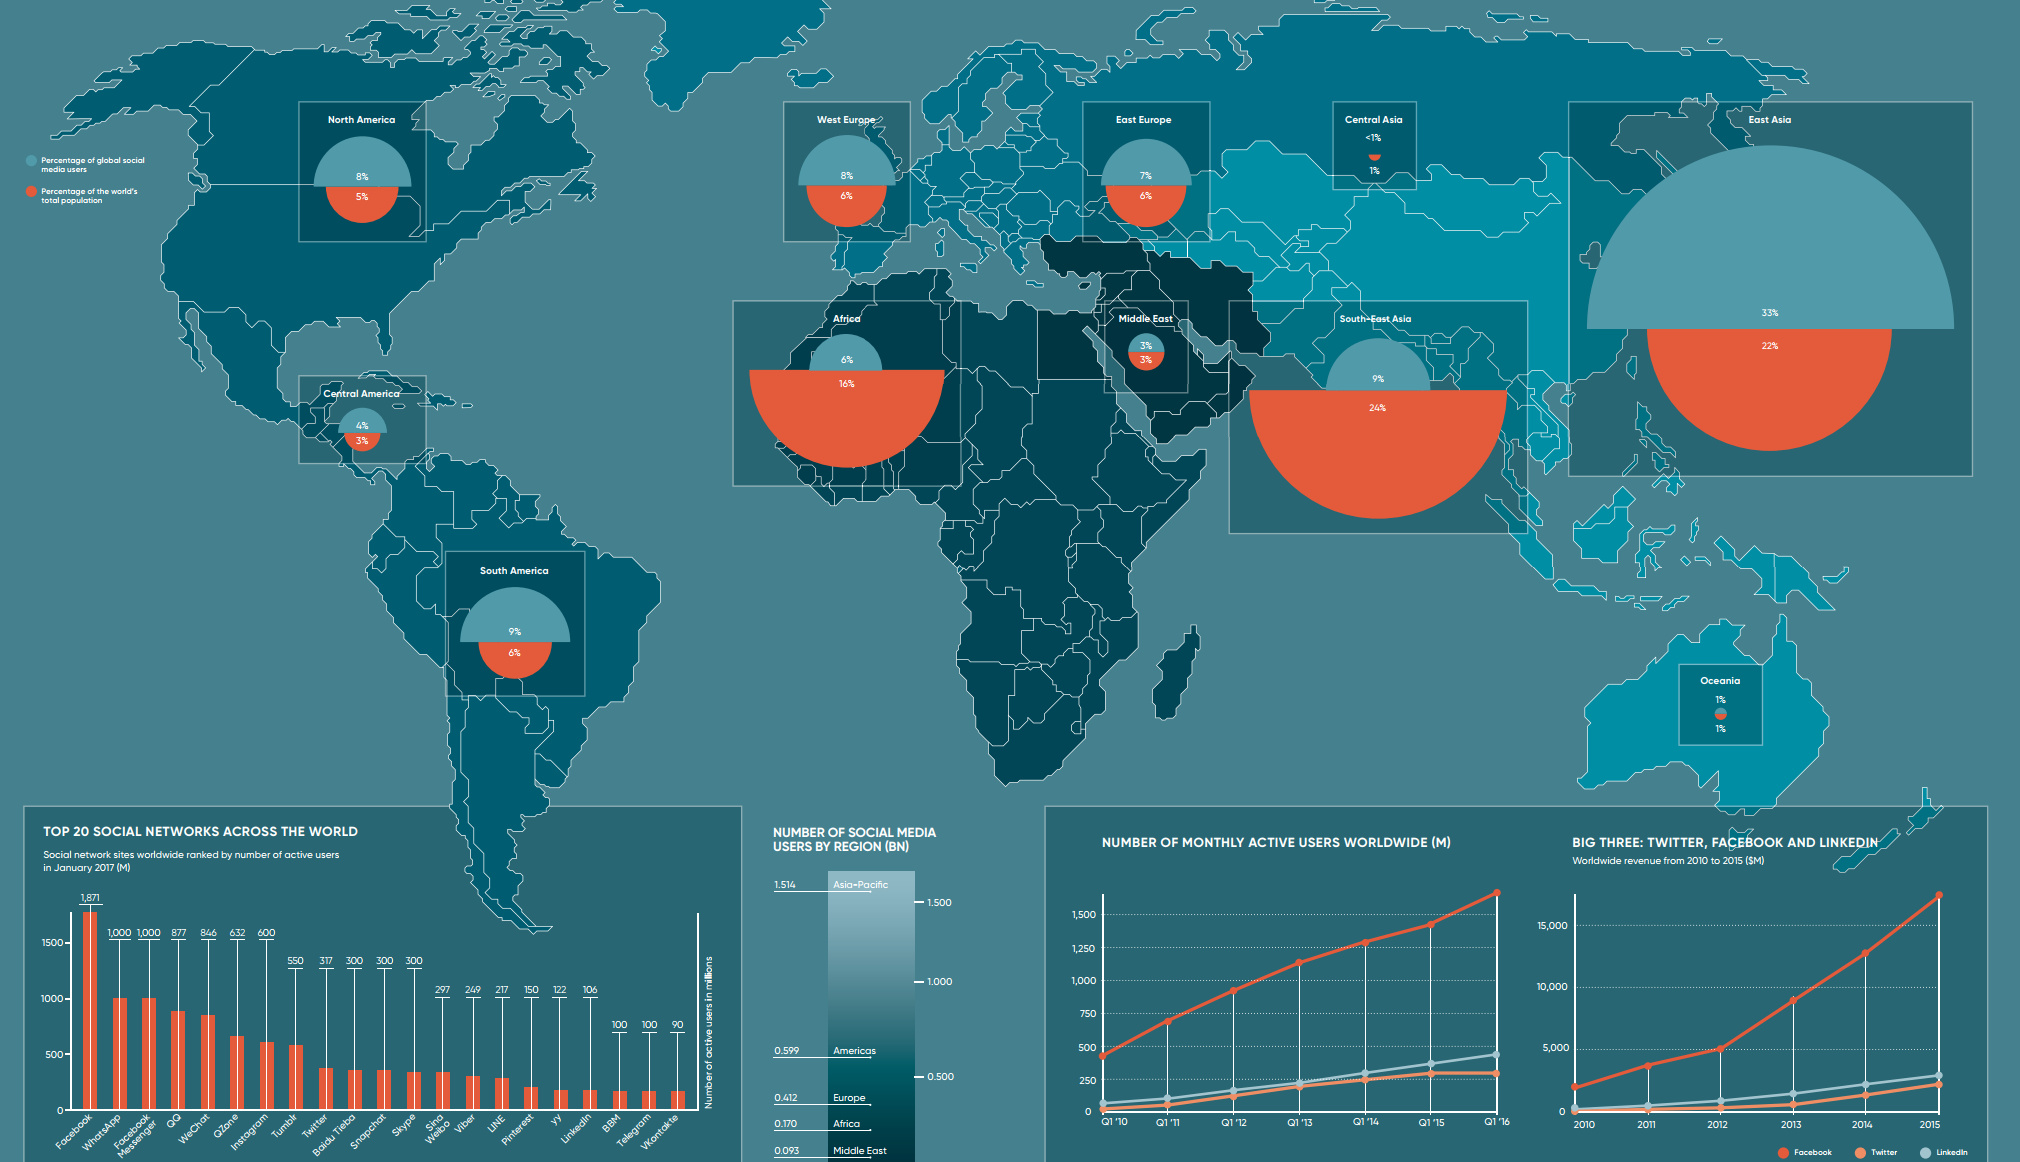
There are roughly 2.8 billion social media users in the world – a penetration of about 37%, according to a recent report by Hootsuite.
| Region | Social Media Population | Actual Population | % Penetration |
|---|---|---|---|
| Asia-Pacific | 1.51 billion | 4.15 billion | 36% |
| Americas | 0.60 billion | 1.01 billion | 60% |
| Europe | 0.41 billion | 0.84 billion | 49% |
| Africa | 0.17 billion | 1.23 billion | 14% |
| Middle East | 0.09 billion | 0.25 billion | 38% |
| Global | 2.79 billion | 7.48 billion | 37% |
While there are not many surprises here, things get more interesting as we dive deeper into the data.
Specifically, as we break down Asia-Pacific’s massive population and level of social media penetration, you’ll see that sub-regions have attributes that are quite different.
| % of Global Social Media Users | % of Actual Population | Difference | |
|---|---|---|---|
| North America | 8% | 5% | +3% |
| Central America | 4% | 3% | +1% |
| South America | 9% | 6% | +3% |
| West Europe | 8% | 6% | +2% |
| Middle East | 3% | 3% | - |
| Africa | 6% | 16% | -10% |
| East Europe | 7% | 6% | +1% |
| Central Asia | <1% | 1% | - |
| South Asia | 9% | 24% | -15% |
| East Asia | 33% | 22% | +11% |
| Southest Asia | 11% | 9% | +2% |
| Oceania | 1% | 1% | - |
The regions with plus numbers (i.e. North America, +3%) have a higher proportion of social media users relative to their actual population. The areas with negative numbers (i.e. Africa, -10%) have less people on social media than one would guess from their total population. These latter areas are also where social media will likely encounter the most growth in users in the near future.
The different sub-regions in Asia are particularly interesting to look at. East Asia is the most “over-represented” population in the social media world with a +11% differential. Meanwhile, neighboring South Asia (-15%) and Southeast Asia (+2%) are two regions that don’t have nearly as many people connected through those mediums.


Technology
Visualizing AI Patents by Country
See which countries have been granted the most AI patents each year, from 2012 to 2022.


Visualizing AI Patents by Country
This was originally posted on our Voronoi app. Download the app for free on iOS or Android and discover incredible data-driven charts from a variety of trusted sources.
This infographic shows the number of AI-related patents granted each year from 2010 to 2022 (latest data available). These figures come from the Center for Security and Emerging Technology (CSET), accessed via Stanford University’s 2024 AI Index Report.
From this data, we can see that China first overtook the U.S. in 2013. Since then, the country has seen enormous growth in the number of AI patents granted each year.
| Year | China | EU and UK | U.S. | RoW | Global Total |
|---|---|---|---|---|---|
| 2010 | 307 | 137 | 984 | 571 | 1,999 |
| 2011 | 516 | 129 | 980 | 581 | 2,206 |
| 2012 | 926 | 112 | 950 | 660 | 2,648 |
| 2013 | 1,035 | 91 | 970 | 627 | 2,723 |
| 2014 | 1,278 | 97 | 1,078 | 667 | 3,120 |
| 2015 | 1,721 | 110 | 1,135 | 539 | 3,505 |
| 2016 | 1,621 | 128 | 1,298 | 714 | 3,761 |
| 2017 | 2,428 | 144 | 1,489 | 1,075 | 5,136 |
| 2018 | 4,741 | 155 | 1,674 | 1,574 | 8,144 |
| 2019 | 9,530 | 322 | 3,211 | 2,720 | 15,783 |
| 2020 | 13,071 | 406 | 5,441 | 4,455 | 23,373 |
| 2021 | 21,907 | 623 | 8,219 | 7,519 | 38,268 |
| 2022 | 35,315 | 1,173 | 12,077 | 13,699 | 62,264 |
In 2022, China was granted more patents than every other country combined.
While this suggests that the country is very active in researching the field of artificial intelligence, it doesn’t necessarily mean that China is the farthest in terms of capability.
Key Facts About AI Patents
According to CSET, AI patents relate to mathematical relationships and algorithms, which are considered abstract ideas under patent law. They can also have different meaning, depending on where they are filed.
In the U.S., AI patenting is concentrated amongst large companies including IBM, Microsoft, and Google. On the other hand, AI patenting in China is more distributed across government organizations, universities, and tech firms (e.g. Tencent).
In terms of focus area, China’s patents are typically related to computer vision, a field of AI that enables computers and systems to interpret visual data and inputs. Meanwhile America’s efforts are more evenly distributed across research fields.
Learn More About AI From Visual Capitalist
If you want to see more data visualizations on artificial intelligence, check out this graphic that shows which job departments will be impacted by AI the most.

-

 Markets1 week ago
U.S. Debt Interest Payments Reach $1 Trillion
-

 Business2 weeks ago
Charted: Big Four Market Share by S&P 500 Audits
-

 Markets2 weeks ago
Ranked: The Most Valuable Housing Markets in America
-

 Money2 weeks ago
Which States Have the Highest Minimum Wage in America?
-

 AI2 weeks ago
Ranked: Semiconductor Companies by Industry Revenue Share
-

 Markets2 weeks ago
Ranked: The World’s Top Flight Routes, by Revenue
-

 Demographics2 weeks ago
Population Projections: The World’s 6 Largest Countries in 2075
-

 Markets2 weeks ago
The Top 10 States by Real GDP Growth in 2023