Energy
Mapped: The 1.2 Billion People Without Access to Electricity
For anyone reading this article, the benefits of electricity need not be explained.
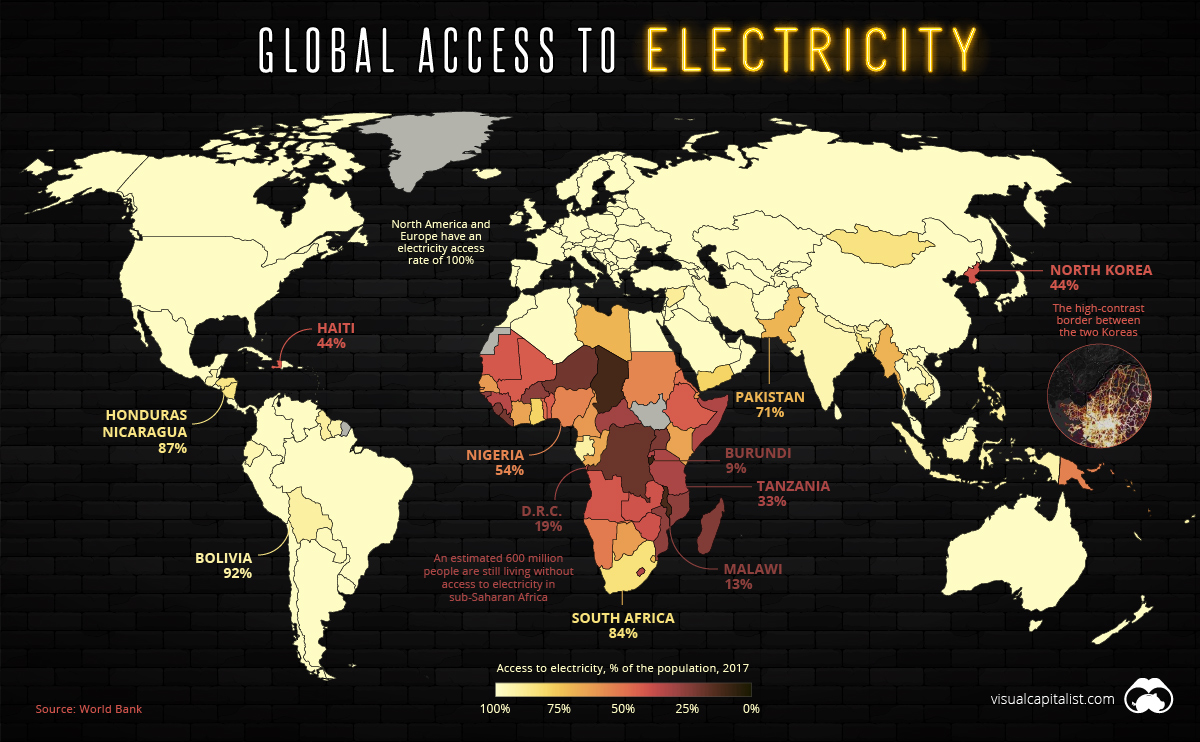
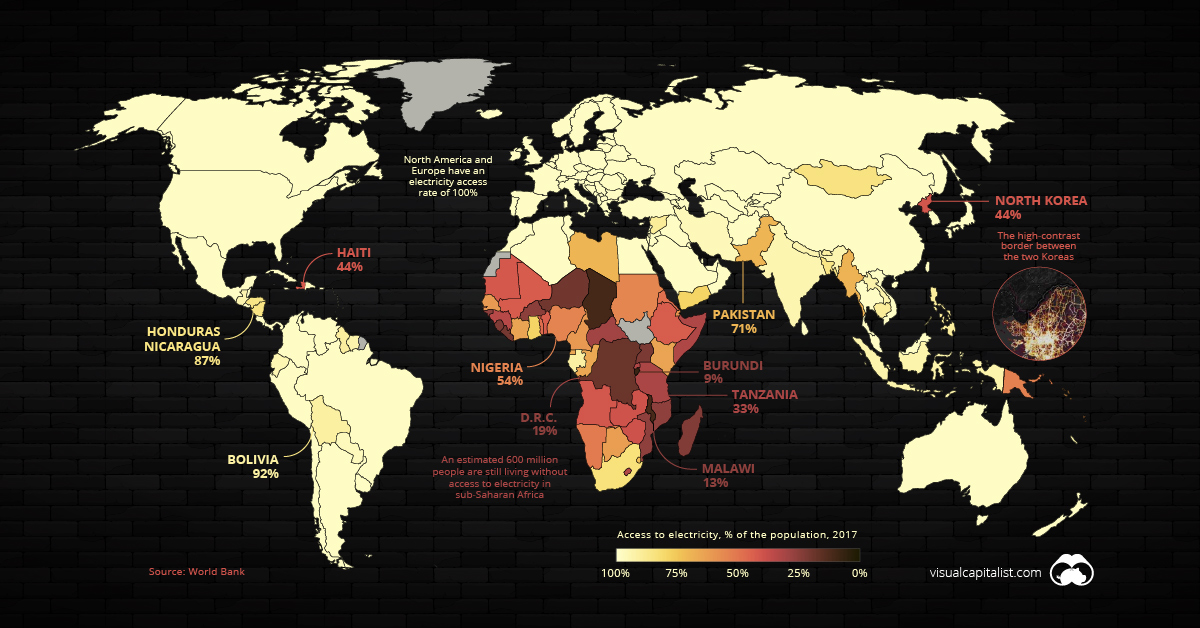
Access to electricity is now an afterthought in most parts of the world, so it may come as a surprise to learn that 16% of the world’s population — an estimated 1.2 billion people — are still living without this basic necessity. Lack of access to electricity, or “energy poverty”, is the ultimate economic hindrance as it prevents people from participating in the modern economy.
Where are people still living in the dark, and how are these energy challenges being addressed? Let’s dive in.
Where the Grid Reaches, and Beyond
At this point in time, a majority of countries have 100% electricity access rates, and many more have rates above 95%. This includes most of the world’s high-population countries, such as China, Brazil, and the United States.
India is fast approaching that benchmark for access. The massive country has made great strides in a short amount of time, jumping from a 70% to 93% access rate in a single decade.
Meanwhile, North Korea is an obvious outlier in East Asia. The Hermit Kingdom’s lack of electrification isn’t just conspicuous in the data — it’s even visible from space. The border between the two Koreas is clearly visible where the dark expanse of North Korea runs up against the glow of South Korea’s urban areas.
It’s been estimated that more than half of North Korea’s people are living in energy poverty.
Africa’s Access to Electricity
In 1995, a mere 20% of sub-Saharan Africa’s population had access to power. While today’s figure is above 40%, that still means roughly 600 million people in the region are living without access to electricity.
Not surprisingly, energy poverty disproportionately impacts rural Africans. Nearly all of the countries with the lowest levels of electricity access have rural-majority populations:
| Global Rank | Country | Electricity Access | Rural Population |
|---|---|---|---|
| #197 | 🇧🇮 Burundi | 9% | 87% |
| #196 | 🇹🇩 Chad | 11% | 77% |
| #195 | 🇲🇼 Malawi | 13% | 83% |
| #194 | 🇨🇩 D.R.C. | 19% | 56% |
| #193 | 🇳🇪 Niger | 20% | 84% |
| #192 | 🇱🇷 Liberia | 21% | 49% |
| #191 | 🇺🇬 Uganda | 22% | 77% |
| #190 | 🇸🇱 Sierra Leone | 23% | 58% |
| #189 | 🇲🇬 Madagascar | 24% | 63% |
| #188 | 🇧🇫 Burkina Faso | 25% | 71% |
Nonexistent and unreliable electricity isn’t just an issue confined to rural Africa. Even Nigeria — Africa’s largest economy — has an electrification rate of just 54%.
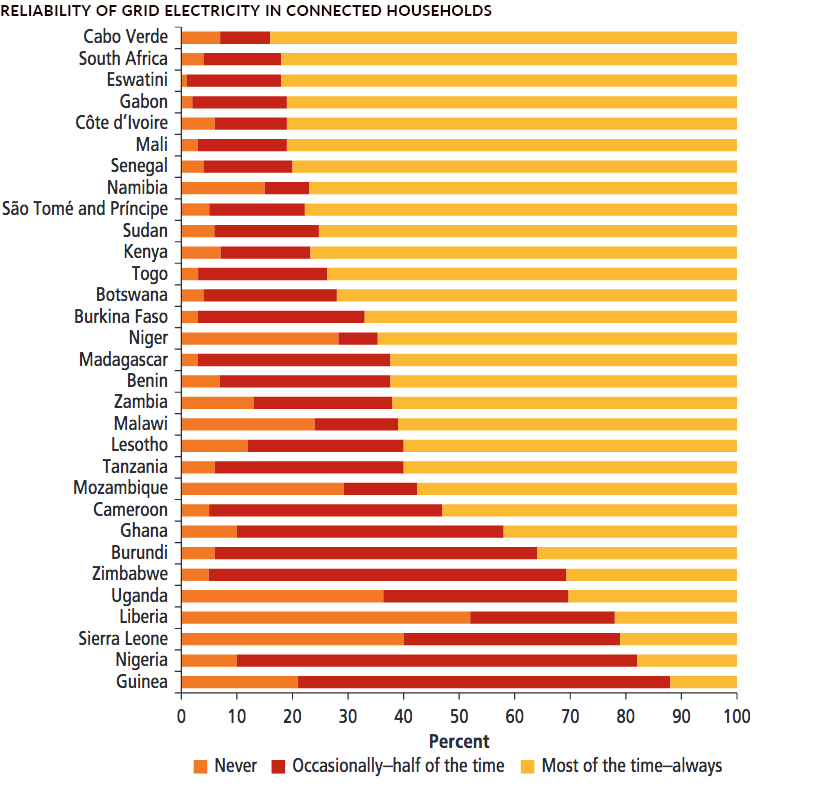
Where there is an electrical grid, instability is also causing problems. A recent survey found that a majority of Nigerian tech firms face 30 or more power outages per month, and more than half ranked electricity as a “major” or “severe” constraint to doing business.
This is pattern that is repeated in a number of countries in Africa:
Mini-Grids, Big Impact
It has taken an average of 25 years for countries to move from 20% to 80% access, so history suggests that it may be a number of years before sub-Saharan Africa fully catches up with other parts of the world. That said, Vietnam was able to close that gap in only nine years.
Traditional utility companies continue to make inroads in the region, but it might be a smaller-scale solution that brings electricity to people in harder-to-reach rural villages.
Between 2009 and 2015, solar PV module prices fell by 80%, ushering in a new era of affordability. Solar powered mini-grids don’t just have the potential to bring electricity to new markets, it can also replace the diesel-powered generators commonly used in Africa.
For the 600 million people in sub-Saharan Africa who are still unable to fully participate in the modern world, these innovations can’t come soon enough.


Energy
Mapped: The Age of Energy Projects in Interconnection Queues, by State
This map shows how many energy projects are in interconnection queues by state and how long these projects have been queued up, on average.


Age of Energy Projects in Interconnection Queues, by State
This was originally posted on our Voronoi app. Download the app for free on iOS or Android and discover incredible data-driven charts from a variety of trusted sources.
By the end of 2023, more than 11,000 energy projects were in interconnection queues in the United States, waiting for a green-light from regional grid operators to proceed with construction.
This map, created in partnership with the National Public Utilities Council, maps out the average age of active energy projects in interconnection queues by state, using data from Berkeley Lab.
Interconnection Queues, Explained
Interconnection queues are lists of energy projects that have made interconnection requests to their regional grid operators. Once submitted, these requests formally initiate the impact study process that each project goes through before grid connection, forming waiting lists for approval known as interconnection queues.
In recent years, both the number and generation capacity of queued projects have surged in the United States, along with the length of time spent in queue.
According to Berkeley Lab, the amount of generation capacity entering queues each year has risen by more than 550% from 2015 to 2023, with average queue duration rising from 3 years to 5 years the same period.
As a result of the growing backlog, a large proportion of projects ultimately withdraw from queues, leading to only 19% of applications reaching commercial operations.
The Backlog: Number of Projects and Average Wait Times
Of the 11,000 active projects in U.S. queues at the end of 2023, Texas, California, and Virginia had the most in queue; 1,208, 947, and 743, respectively.
When looking at the average ages of these projects, all three states hovered around the national average of 34 months (2.83 years), with Texas sporting 28 months, California 33, and Virginia 34.
Vermont, Minnesota, Wisconsin, and Florida, on the other hand, had the highest average queue durations; 54, 49, 47, and 46 months, respectively.
Average Queue Duration by Project Type
At the end of 2023, more than 95% of the generation capacity in active interconnection queues was for emission-free resources. The table below provides a breakdown.
| Project Type | Average Queue Duration (As of 12/31/2023) | Number of Projects in Queue |
|---|---|---|
| Wind | 40 months | 841 |
| Solar | 34 months | 4,506 |
| Wind+Battery | 34 months | 76 |
| Solar+Battery | 27 months | 2,377 |
| Battery | 24 months | 2,818 |
Wind projects had the highest wait times at the end of 2023 with an average age of 40 months (3.33 years). Solar projects, on the other hand, made up more than 40% of projects in queue.
Overall, reducing the time that these renewable energy projects spend in queues can accelerate the transition to a low-carbon energy future.
According to the U.S. Department of Energy, enhancing data transparency, streamlining approval processes, promoting economic efficiency, and maintaining a reliable grid are some of the ways this growing backlog can be mitigated.

-

 Technology7 days ago
All of the Grants Given by the U.S. CHIPS Act
-

 Uranium2 weeks ago
The World’s Biggest Nuclear Energy Producers
-

 Education2 weeks ago
How Hard Is It to Get Into an Ivy League School?
-

 Debt2 weeks ago
How Debt-to-GDP Ratios Have Changed Since 2000
-

 Sports2 weeks ago
The Highest Earning Athletes in Seven Professional Sports
-

 Science2 weeks ago
Visualizing the Average Lifespans of Mammals
-

 Brands1 week ago
How Tech Logos Have Evolved Over Time
-

 Energy1 week ago
Ranked: The Top 10 EV Battery Manufacturers in 2023