Energy
Life Cycle Emissions: EVs vs. Combustion Engine Vehicles
![]() Subscribe to the Elements free mailing list for more like this
Subscribe to the Elements free mailing list for more like this


Life Cycle Emissions: EVs vs. Combustion Engine Vehicles
This was originally posted on Elements. Sign up to the free mailing list to get beautiful visualizations on real assets and resource megatrends each week.
According to the International Energy Agency, the transportation sector is more reliant on fossil fuels than any other sector in the economy. In 2021, it accounted for 37% of all CO2 emissions from end‐use sectors.
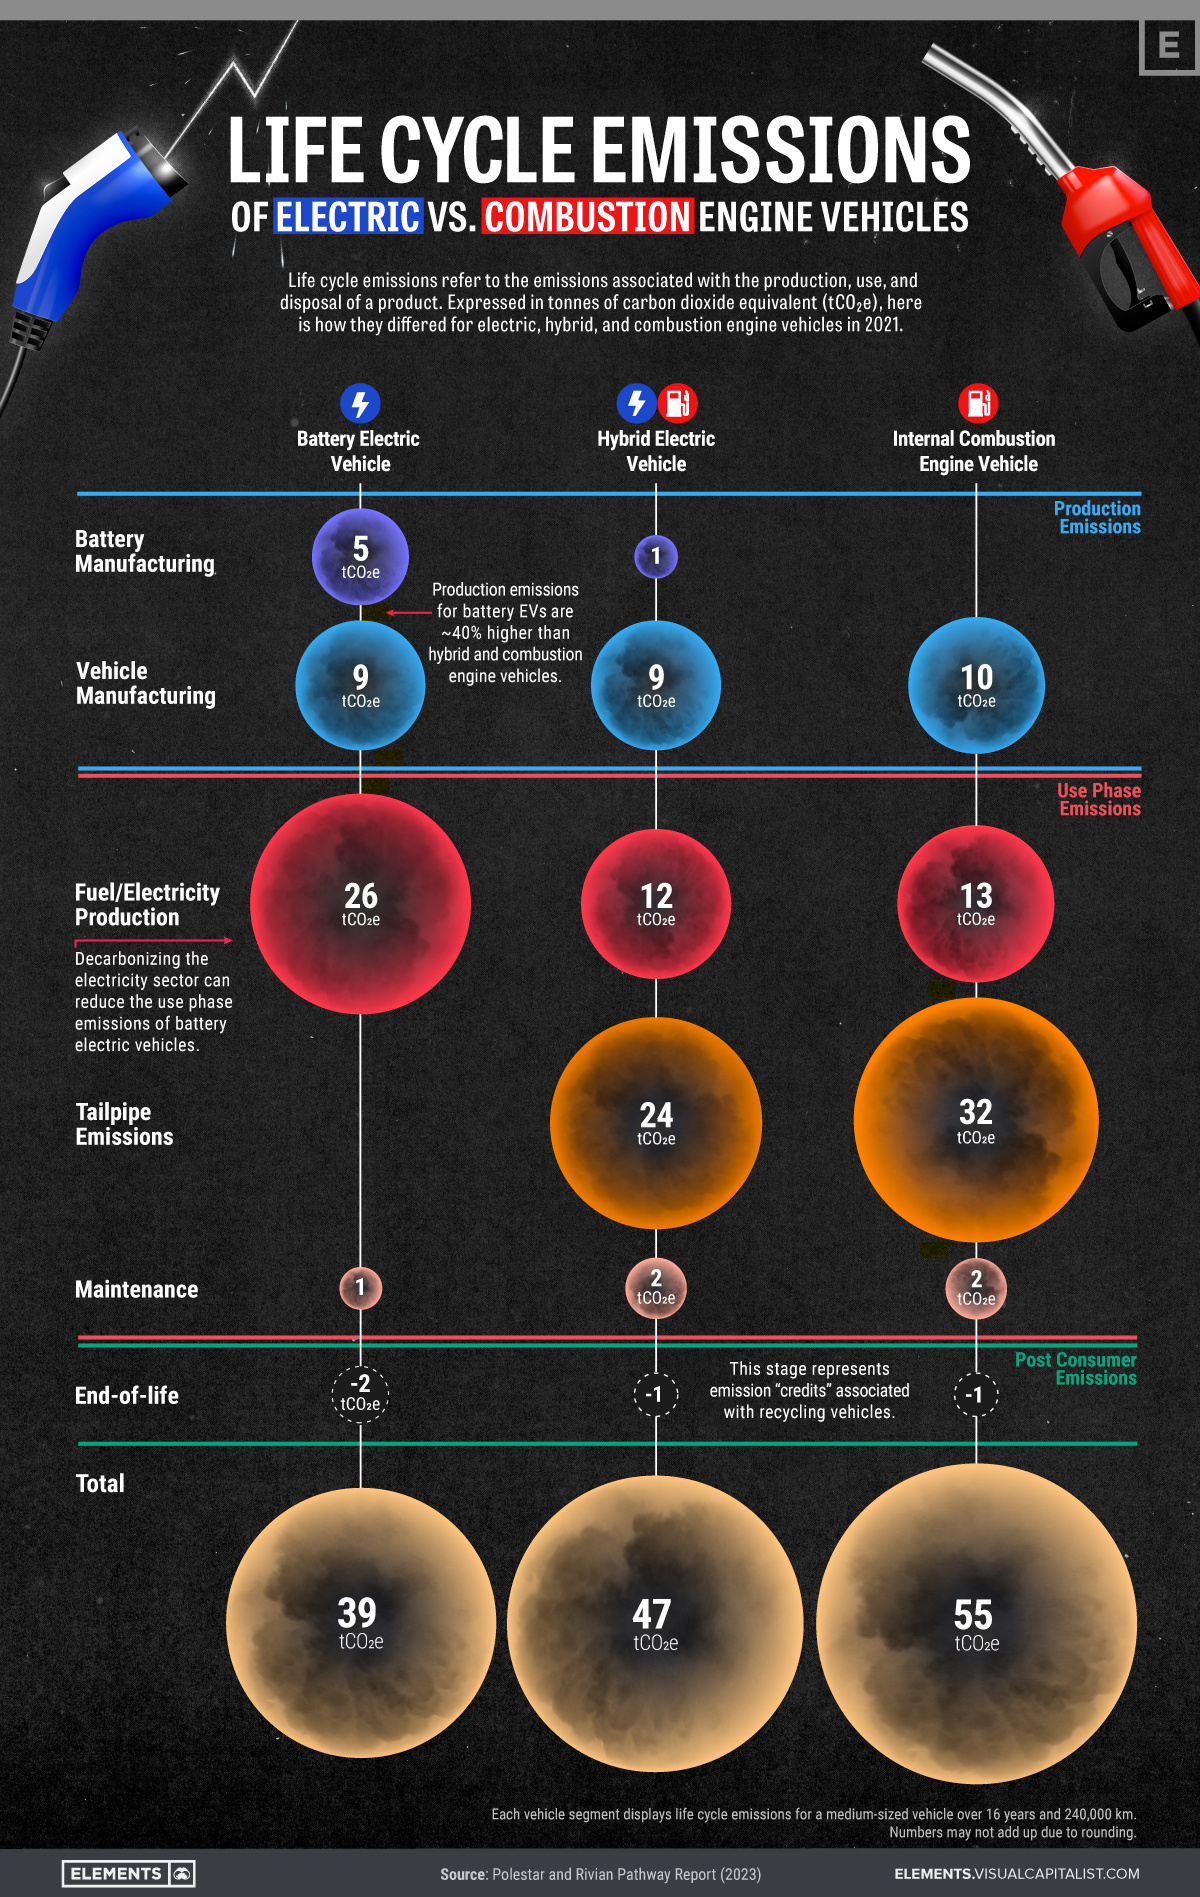
To gain insights into how different vehicle types contribute to these emissions, the above graphic visualizes the life cycle emissions of battery electric, hybrid, and internal combustion engine (ICE) vehicles using Polestar and Rivian’s Pathway Report.
Production to Disposal: Emissions at Each Stage
Life cycle emissions are the total amount of greenhouse gases emitted throughout a product’s existence, including its production, use, and disposal.
To compare these emissions effectively, a standardized unit called metric tons of CO2 equivalent (tCO2e) is used, which accounts for different types of greenhouse gases and their global warming potential.
Here is an overview of the 2021 life cycle emissions of medium-sized electric, hybrid and ICE vehicles in each stage of their life cycles, using tCO2e. These numbers consider a use phase of 16 years and a distance of 240,000 km.
| Battery electric vehicle | Hybrid electric vehicle | Internal combustion engine vehicle | ||
|---|---|---|---|---|
| Production emissions (tCO2e) | Battery manufacturing | 5 | 1 | 0 |
| Vehicle manufacturing | 9 | 9 | 10 | |
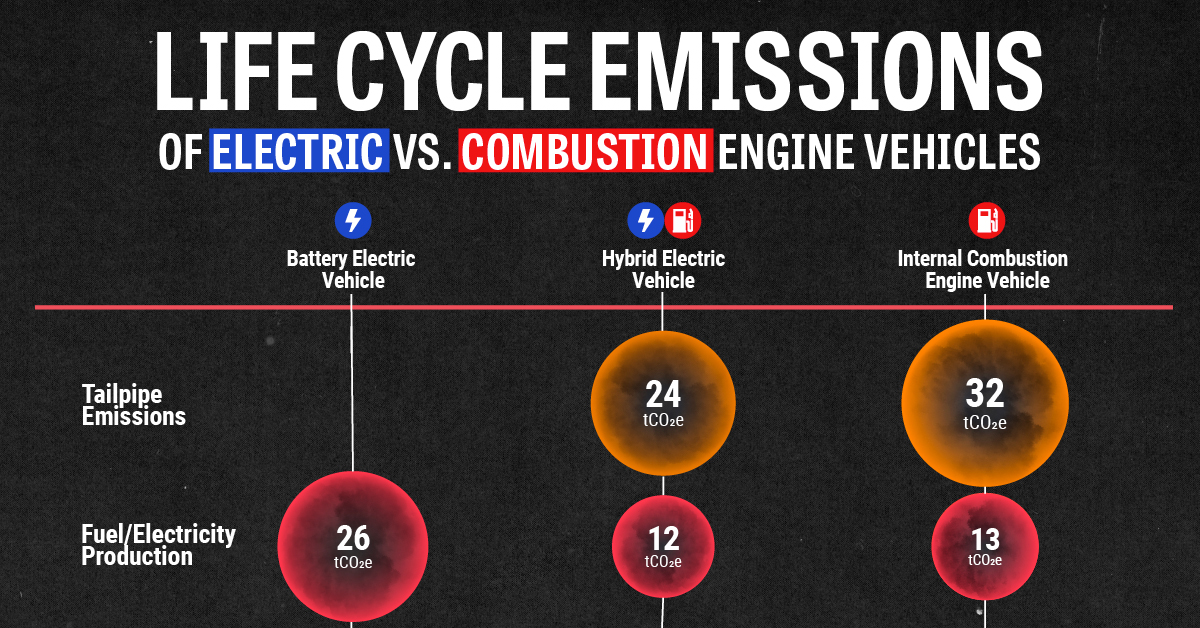
| Use phase emissions (tCO2e) | Fuel/electricity production | 26 | 12 | 13 |
| Tailpipe emissions | 0 | 24 | 32 | |
| Maintenance | 1 | 2 | 2 | |
| Post consumer emissions (tCO2e) | End-of-life | -2 | -1 | -1 |
| TOTAL | 39 tCO2e | 47 tCO2e | 55 tCO2e |
While it may not be surprising that battery electric vehicles (BEVs) have the lowest life cycle emissions of the three vehicle segments, we can also take some other insights from the data that may not be as obvious at first.
- The production emissions for BEVs are approximately 40% higher than those of hybrid and ICE vehicles. According to a McKinsey & Company study, this high emission intensity can be attributed to the extraction and refining of raw materials like lithium, cobalt, and nickel that are needed for batteries, as well as the energy-intensive manufacturing process of BEVs.
- Electricity production is by far the most emission-intensive stage in a BEVs life cycle. Decarbonizing the electricity sector by implementing renewable and nuclear energy sources can significantly reduce these vehicles’ use phase emissions.
- By recycling materials and components in their end-of-life stages, all vehicle segments can offset a portion of their earlier life cycle emissions.
Accelerating the Transition to Electric Mobility
As we move toward a carbon-neutral economy, battery electric vehicles can play an important role in reducing global CO2 emissions.
Despite their lack of tailpipe emissions, however, it’s good to note that many stages of a BEV’s life cycle are still quite emission-intensive, specifically when it comes to manufacturing and electricity production.
Advancing the sustainability of battery production and fostering the adoption of clean energy sources can, therefore, aid in lowering the emissions of BEVs even further, leading to increased environmental stewardship in the transportation sector.


Who’s Building the Most Solar Energy?
This was originally posted on our Voronoi app. Download the app for free on iOS or Android and discover incredible data-driven charts from a variety of trusted sources.
In 2023, solar energy accounted for three-quarters of renewable capacity additions worldwide. Most of this growth occurred in Asia, the EU, and the U.S., continuing a trend observed over the past decade.
In this graphic, we illustrate the rise in installed solar photovoltaic (PV) capacity in China, the EU, and the U.S. between 2010 and 2022, measured in gigawatts (GW). Bruegel compiled the data..
Chinese Dominance
As of 2022, China’s total installed capacity stands at 393 GW, nearly double that of the EU’s 205 GW and surpassing the USA’s total of 113 GW by more than threefold in absolute terms.
| Installed solar capacity (GW) | China | EU27 | U.S. |
|---|---|---|---|
| 2022 | 393.0 | 205.5 | 113.0 |
| 2021 | 307.0 | 162.7 | 95.4 |
| 2020 | 254.0 | 136.9 | 76.4 |
| 2019 | 205.0 | 120.1 | 61.6 |
| 2018 | 175.3 | 104.0 | 52.0 |
| 2017 | 130.8 | 96.2 | 43.8 |
| 2016 | 77.8 | 91.5 | 35.4 |
| 2015 | 43.6 | 87.7 | 24.2 |
| 2014 | 28.4 | 83.6 | 18.1 |
| 2013 | 17.8 | 79.7 | 13.3 |
| 2012 | 6.7 | 71.1 | 8.6 |
| 2011 | 3.1 | 53.3 | 5.6 |
| 2010 | 1.0 | 30.6 | 3.4 |
Since 2017, China has shown a compound annual growth rate (CAGR) of approximately 25% in installed PV capacity, while the USA has seen a CAGR of 21%, and the EU of 16%.
Additionally, China dominates the production of solar power components, currently controlling around 80% of the world’s solar panel supply chain.
In 2022, China’s solar industry employed 2.76 million individuals, with manufacturing roles representing approximately 1.8 million and the remaining 918,000 jobs in construction, installation, and operations and maintenance.
The EU industry employed 648,000 individuals, while the U.S. reached 264,000 jobs.
According to the IEA, China accounts for almost 60% of new renewable capacity expected to become operational globally by 2028.
Despite the phasing out of national subsidies in 2020 and 2021, deployment of solar PV in China is accelerating. The country is expected to reach its national 2030 target for wind and solar PV installations in 2024, six years ahead of schedule.

-

 Markets5 days ago
Visualizing Global Inflation Forecasts (2024-2026)
-

 Green2 weeks ago
The Carbon Footprint of Major Travel Methods
-

 United States2 weeks ago
Visualizing the Most Common Pets in the U.S.
-

 Culture2 weeks ago
The World’s Top Media Franchises by All-Time Revenue
-

 voronoi1 week ago
Best Visualizations of April on the Voronoi App
-

 Wealth1 week ago
Charted: Which Country Has the Most Billionaires in 2024?
-

 Business1 week ago
The Top Private Equity Firms by Country
-

 Markets1 week ago
The Best U.S. Companies to Work for According to LinkedIn