Markets
Intangible Assets: A Hidden but Crucial Driver of Company Value
View the full-size version of this infographic.

Intangible Assets Take Center Stage
View the high resolution version of this infographic by clicking here
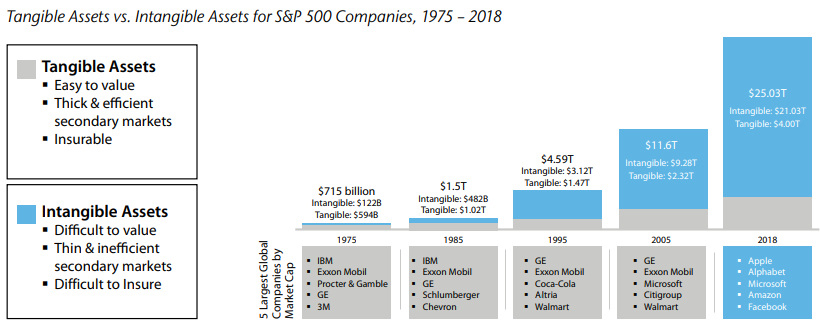
In 2018, intangible assets for S&P 500 companies hit a record value of $21 trillion. These assets, which are not physical in nature and include things like intellectual property, have rapidly risen in importance compared to tangible assets like cash.
Today’s infographic from Raconteur highlights the growth of intangible asset valuations, and how senior decision-makers view intangibles when making investment decisions.
Tracking the Growth of Intangibles
Intangibles used to play a much smaller role than they do now, with physical assets comprising the majority of value for most enterprise companies. However, an increasingly competitive and digital economy has placed the focus on things like intellectual property, as companies race to out-innovate one another.
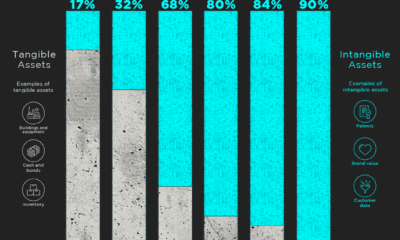
To measure this historical shift, Aon and the Ponemon Institute analyzed the value of intangible and tangible assets over nearly four and a half decades on the S&P 500. Here’s how they stack up:
Source: Aon
In just 43 years, intangibles have evolved from a supporting asset into a major consideration for investors – today, they make up 84% of all enterprise value on the S&P 500, a massive increase from just 17% in 1975.
The Largest Companies by Intangible Value
Digital-centric sectors, such as internet & software and technology & IT, are heavily reliant on intangible assets.
Brand Finance, which produces an annual ranking of companies based on intangible value, has companies in these sectors taking the top five spots on the 2019 edition of their report.
| Rank | Company | Sector | Total Intangible Value | Share of Enterprise Value |
|---|---|---|---|---|
| 1 | Microsoft | Internet & Software | $904B | 90% |
| 2 | Amazon | Internet & Software | $839B | 93% |
| 3 | Apple | Technology & IT | $675B | 77% |
| 4 | Alphabet | Internet & Software | $521B | 65% |
| 5 | Internet & Software | $409B | 79% | |
| 6 | AT&T | Telecoms | $371B | 84% |
| 7 | Tencent | Internet & Software | $365B | 88% |
| 8 | Johnson & Johnson | Pharma | $361B | 101% |
| 9 | Visa | Banking | $348B | 100% |
| 10 | Alibaba | Internet & Software | $344B | 86% |
| 11 | Nestle | Food | $313B | 89% |
| 12 | Procter & Gamble | Cosmetics & Personal Care | $305B | 101% |
| 13 | Anheuser-Busch InBev | Beers | $304B | 99% |
| 14 | Verizon | Telecoms | $300B | 83% |
| 15 | Comcast | Media | $276B | 92% |
| 16 | Mastercard | Banking | $259B | 99% |
| 17 | Novartis | Pharma | $252B | 101% |
| 18 | Walmart | Retail | $252B | 68% |
| 19 | Unitedhealth | Healthcare | $245B | 94% |
| 20 | Pfizer | Pharma | $235B | 98% |
Note: Percentages may exceed 100% due to rounding.
Microsoft overtook Amazon for the top spot in the ranking for 2019, with $904B in intangible assets. The company has the largest commercial cloud business in the world.
Pharma and healthcare companies are also prominent on the list, comprising four of the top 20. Their intangible value is largely driven by patents, as well as mergers and acquisitions. Johnson & Johnson, for example, reported $32B in patents and trademarks in their latest annual report.
A Lack of Disclosure
It’s important to note that Brand Finance’s ranking is based on both disclosed intangibles—those that are reported on a company’s balance sheet—and undisclosed intangibles. In the ranking, undisclosed intangibles were calculated as the difference between a company’s market value and book value.
The majority of intangibles are not reported on balance sheets because accounting standards do not recognize them until a transaction has occurred to support their value. While many accounting managers see this as a prudent measure to stop unsubstantiated asset values, it means that many highly valuable intangibles never appear in financial reporting. In fact, 34% of the total worth of the world’s publicly traded companies is made up of undisclosed value.
“It is time for CEOs, CFOs, and CMOs to start a long overdue reporting revolution.”
—David Haigh, CEO of Brand Finance
Brand Finance believes that companies should regularly value each intangible asset, including the key assumptions management made when deriving their value. This information would be extremely useful for managers, investors, and other stakeholders.
A Key Consideration
Investment professionals certainly agree on the importance of intangibles. In a survey of institutional investors by Columbia Threadneedle, it was found that 95% agreed that intangible assets contain crucial information about the future strength of a company’s business model.
Moreover, 98% agree that more transparency would be beneficial to their assessment of intangible assets. In the absence of robust reporting, Columbia Threadneedle believes active managers are well equipped to understand intangible asset values due to their access to management, relationships with key opinion leaders, and deep industry expertise.
By undertaking rigorous analysis, managers may uncover hidden competitive advantages—and generate higher potential returns in the process.


Markets
Visualizing Global Inflation Forecasts (2024-2026)
Here are IMF forecasts for global inflation rates up to 2026, highlighting a slow descent of price pressures amid resilient global growth.


Visualizing Global Inflation Forecasts (2024-2026)
Global inflation rates are gradually descending, but progress has been slow.
Today, the big question is if inflation will decline far enough to trigger easing monetary policy. So far, the Federal Reserve has held rates for nine months amid stronger than expected core inflation, which excludes volatile energy and food prices.
Yet looking further ahead, inflation forecasts from the International Monetary Fund (IMF) suggest that inflation will decline as price pressures ease, but the path of disinflation is not without its unknown risks.
This graphic shows global inflation forecasts, based on data from the April 2024 IMF World Economic Outlook.
Get the Key Insights of the IMF’s World Economic Outlook
Want a visual breakdown of the insights from the IMF’s 2024 World Economic Outlook report?
This visual is part of a special dispatch of the key takeaways exclusively for VC+ members.
Get the full dispatch of charts by signing up to VC+.
The IMF’s Inflation Outlook
Below, we show the IMF’s latest projections for global inflation rates through to 2026:
| Year | Global Inflation Rate (%) | Advanced Economies Inflation Rate (%) | Emerging Market and Developing Economies Inflation Rate (%) |
|---|---|---|---|
| 2019 | 3.5 | 1.4 | 5.1 |
| 2020 | 3.2 | 0.7 | 5.2 |
| 2021 | 4.7 | 3.1 | 5.9 |
| 2022 | 8.7 | 7.3 | 9.8 |
| 2023 | 6.8 | 4.6 | 8.3 |
| 2024 | 5.9 | 2.6 | 8.3 |
| 2025 | 4.5 | 2.0 | 6.2 |
| 2026 | 3.7 | 2.0 | 4.9 |
After hitting a peak of 8.7% in 2022, global inflation is projected to fall to 5.9% in 2024, reflecting promising inflation trends amid resilient global growth.
While inflation has largely declined due to falling energy and goods prices, persistently high services inflation poses challenges to mitigating price pressures. In addition, the IMF highlights the potential risk of an escalating conflict in the Middle East, which could lead to energy price shocks and higher shipping costs.
These developments could negatively affect inflation scenarios and prompt central banks to adopt tighter monetary policies. Overall, by 2026, global inflation is anticipated to decline to 3.7%—still notably above the 2% target set by several major economies.
Adding to this, we can see divergences in the path of inflation between advanced and emerging economies. While affluent nations are forecast to see inflation edge closer to the 2% target by 2026, emerging economies are projected to have inflation rates reach 4.9%—falling closer to their pre-pandemic averages.
Get the Full Analysis of the IMF’s Outlook on VC+
This visual is part of an exclusive special dispatch for VC+ members which breaks down the key takeaways from the IMF’s 2024 World Economic Outlook.
For the full set of charts and analysis, sign up for VC+.

-

 Culture6 days ago
The World’s Top Media Franchises by All-Time Revenue
-

 Science2 weeks ago
Visualizing the Average Lifespans of Mammals
-

 Brands2 weeks ago
How Tech Logos Have Evolved Over Time
-

 Energy2 weeks ago
Ranked: The Top 10 EV Battery Manufacturers in 2023
-

 Countries2 weeks ago
Countries With the Largest Happiness Gains Since 2010
-

 Economy2 weeks ago
VC+: Get Our Key Takeaways From the IMF’s World Economic Outlook
-

 Demographics2 weeks ago
The Countries That Have Become Sadder Since 2010
-

 Money1 week ago
Charted: Who Has Savings in This Economy?