Markets
Global Stock Markets Off to Worst Start in History [Chart]
![Global Stock Markets Off to Worst Start in History [Chart]](https://www.visualcapitalist.com/wp-content/uploads/2016/01/worst-start-markets-2016-chart.png)
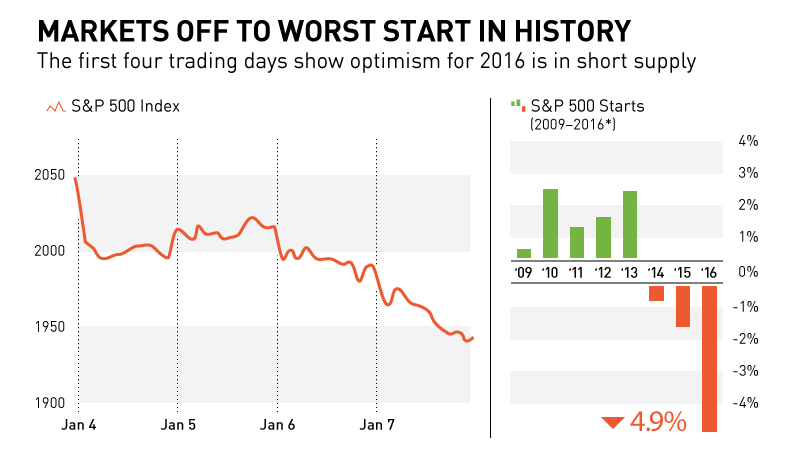
Global Stock Markets Off to Worst Start in History [Chart]
The first four trading days show optimism for 2016 is in short supply.
The Chart of the Week is a weekly Visual Capitalist feature on Fridays.
In our review of the economic events of 2015, we noted that the simple turning of a calendar page does not rectify the problems of the previous year.
The first week of trading on major exchanges has made this even more clear.
China’s Rough Start
China kicked off the volatility this week with multiple devaluations of the yuan to reduce the strain on its foreign reserves, after burning through $120 billion in the month of December.
In reaction to this news, as well as the updated manufacturing data out of China at the beginning of the week, the Chinese stock market plunged to start 2016. The “blue chip” CSI 300 index fell 7% on Monday to trigger a market intervention mechanism that halted trading. On Thursday the problems continued when the market opened down 5% almost instantly, triggering the same mechanism to provide a 15 minute trading break. Markets re-opened, plunged again, and got halted for the rest of the day.
Here’s what that whole 29 minute session looked like on Thursday, including the 15 minute break:
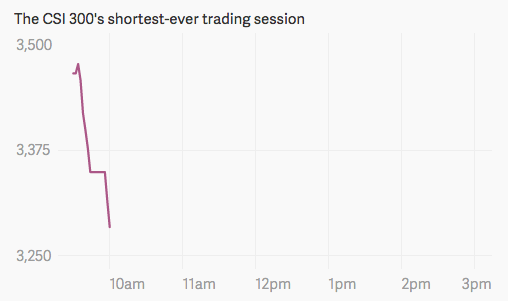
This morning, the yuan was strengthened and it had a semi-calming effect. The CSI 300 finished up Friday’s trading in positive territory, but it is still down -9.9% for the first complete week of 2016.
The Spillover Effect
The whiplash from China’s tumultuous market was enough to put other global markets in a tizzy. This week’s Chart of the Week shows the first four days of trading on major world markets.
The S&P 500 and Dow Jones Industrial Average both opened 2016 with their worst four-day starts in history. The Nasdaq also was also down 6.4% in the first four days of trading, which took it into correction territory.
Canada’s TSX continued on its 19% decline since April 2015 and European markets have been hard-hit as well. Germany’s DAX was down 7.1% to start the year, and the FTSE 100 declined 4.8%.
Meanwhile, crude oil (WTI) is now $33, which is its lowest price in 14 years.
Yearly Starts Trending Worse
Another point we noted in the chart above is that the starts for the S&P 500 have been trending more towards negative territory each year since the Financial Crisis.
| Year | Return |
|---|---|
| 2009 | 0.4% |
| 2010 | 2.4% |
| 2011 | 1.3% |
| 2012 | 1.6% |
| 2013 | 2.5% |
| 2014 | -0.6% |
| 2015 | -1.6% |
| 2016 | -4.9% |
In recent times, it seems investors are starting each new year more anxious to pull the “sell” trigger. Proceed with caution in 2017.


Markets
The European Stock Market: Attractive Valuations Offer Opportunities
On average, the European stock market has valuations that are nearly 50% lower than U.S. valuations. But how can you access the market?


European Stock Market: Attractive Valuations Offer Opportunities
Europe is known for some established brands, from L’Oréal to Louis Vuitton. However, the European stock market offers additional opportunities that may be lesser known.
The above infographic, sponsored by STOXX, outlines why investors may want to consider European stocks.
Attractive Valuations
Compared to most North American and Asian markets, European stocks offer lower or comparable valuations.
| Index | Price-to-Earnings Ratio | Price-to-Book Ratio |
|---|---|---|
| EURO STOXX 50 | 14.9 | 2.2 |
| STOXX Europe 600 | 14.4 | 2 |
| U.S. | 25.9 | 4.7 |
| Canada | 16.1 | 1.8 |
| Japan | 15.4 | 1.6 |
| Asia Pacific ex. China | 17.1 | 1.8 |
Data as of February 29, 2024. See graphic for full index names. Ratios based on trailing 12 month financials. The price to earnings ratio excludes companies with negative earnings.
On average, European valuations are nearly 50% lower than U.S. valuations, potentially offering an affordable entry point for investors.
Research also shows that lower price ratios have historically led to higher long-term returns.
Market Movements Not Closely Connected
Over the last decade, the European stock market had low-to-moderate correlation with North American and Asian equities.
The below chart shows correlations from February 2014 to February 2024. A value closer to zero indicates low correlation, while a value of one would indicate that two regions are moving in perfect unison.
| EURO STOXX 50 | STOXX EUROPE 600 | U.S. | Canada | Japan | Asia Pacific ex. China |
|
|---|---|---|---|---|---|---|
| EURO STOXX 50 | 1.00 | 0.97 | 0.55 | 0.67 | 0.24 | 0.43 |
| STOXX EUROPE 600 | 1.00 | 0.56 | 0.71 | 0.28 | 0.48 | |
| U.S. | 1.00 | 0.73 | 0.12 | 0.25 | ||
| Canada | 1.00 | 0.22 | 0.40 | |||
| Japan | 1.00 | 0.88 | ||||
| Asia Pacific ex. China | 1.00 |
Data is based on daily USD returns.
European equities had relatively independent market movements from North American and Asian markets. One contributing factor could be the differing sector weights in each market. For instance, technology makes up a quarter of the U.S. market, but health care and industrials dominate the broader European market.
Ultimately, European equities can enhance portfolio diversification and have the potential to mitigate risk for investors.
Tracking the Market
For investors interested in European equities, STOXX offers a variety of flagship indices:
| Index | Description | Market Cap |
|---|---|---|
| STOXX Europe 600 | Pan-regional, broad market | €10.5T |
| STOXX Developed Europe | Pan-regional, broad-market | €9.9T |
| STOXX Europe 600 ESG-X | Pan-regional, broad market, sustainability focus | €9.7T |
| STOXX Europe 50 | Pan-regional, blue-chip | €5.1T |
| EURO STOXX 50 | Eurozone, blue-chip | €3.5T |
Data is as of February 29, 2024. Market cap is free float, which represents the shares that are readily available for public trading on stock exchanges.
The EURO STOXX 50 tracks the Eurozone’s biggest and most traded companies. It also underlies one of the world’s largest ranges of ETFs and mutual funds. As of November 2023, there were €27.3 billion in ETFs and €23.5B in mutual fund assets under management tracking the index.
“For the past 25 years, the EURO STOXX 50 has served as an accurate, reliable and tradable representation of the Eurozone equity market.”
— Axel Lomholt, General Manager at STOXX
Partnering with STOXX to Track the European Stock Market
Are you interested in European equities? STOXX can be a valuable partner:
- Comprehensive, liquid and investable ecosystem
- European heritage, global reach
- Highly sophisticated customization capabilities
- Open architecture approach to using data
- Close partnerships with clients
- Part of ISS STOXX and Deutsche Börse Group
With a full suite of indices, STOXX can help you benchmark against the European stock market.
Learn how STOXX’s European indices offer liquid and effective market access.

-

 Economy2 days ago
Economic Growth Forecasts for G7 and BRICS Countries in 2024
The IMF has released its economic growth forecasts for 2024. How do the G7 and BRICS countries compare?
-

 Markets1 week ago
U.S. Debt Interest Payments Reach $1 Trillion
U.S. debt interest payments have surged past the $1 trillion dollar mark, amid high interest rates and an ever-expanding debt burden.
-

 United States2 weeks ago
Ranked: The Largest U.S. Corporations by Number of Employees
We visualized the top U.S. companies by employees, revealing the massive scale of retailers like Walmart, Target, and Home Depot.
-

 Markets2 weeks ago
The Top 10 States by Real GDP Growth in 2023
This graphic shows the states with the highest real GDP growth rate in 2023, largely propelled by the oil and gas boom.
-

 Markets2 weeks ago
Ranked: The World’s Top Flight Routes, by Revenue
In this graphic, we show the highest earning flight routes globally as air travel continued to rebound in 2023.
-

 Markets3 weeks ago
Ranked: The Most Valuable Housing Markets in America
The U.S. residential real estate market is worth a staggering $47.5 trillion. Here are the most valuable housing markets in the country.


-

 Debt1 week ago
How Debt-to-GDP Ratios Have Changed Since 2000
-
Markets2 weeks ago
Ranked: The World’s Top Flight Routes, by Revenue
-

 Countries2 weeks ago
Population Projections: The World’s 6 Largest Countries in 2075
-
Markets2 weeks ago
The Top 10 States by Real GDP Growth in 2023
-

 Demographics2 weeks ago
The Smallest Gender Wage Gaps in OECD Countries
-

 United States2 weeks ago
Where U.S. Inflation Hit the Hardest in March 2024
-

 Green2 weeks ago
Top Countries By Forest Growth Since 2001
-
United States2 weeks ago
Ranked: The Largest U.S. Corporations by Number of Employees