Markets
Germany’s Demographic Cliff [Chart]
![Germany's Demographic Cliff [Chart]](https://www.visualcapitalist.com/wp-content/uploads/2016/02/germany-demographic-cliff-chart.png)
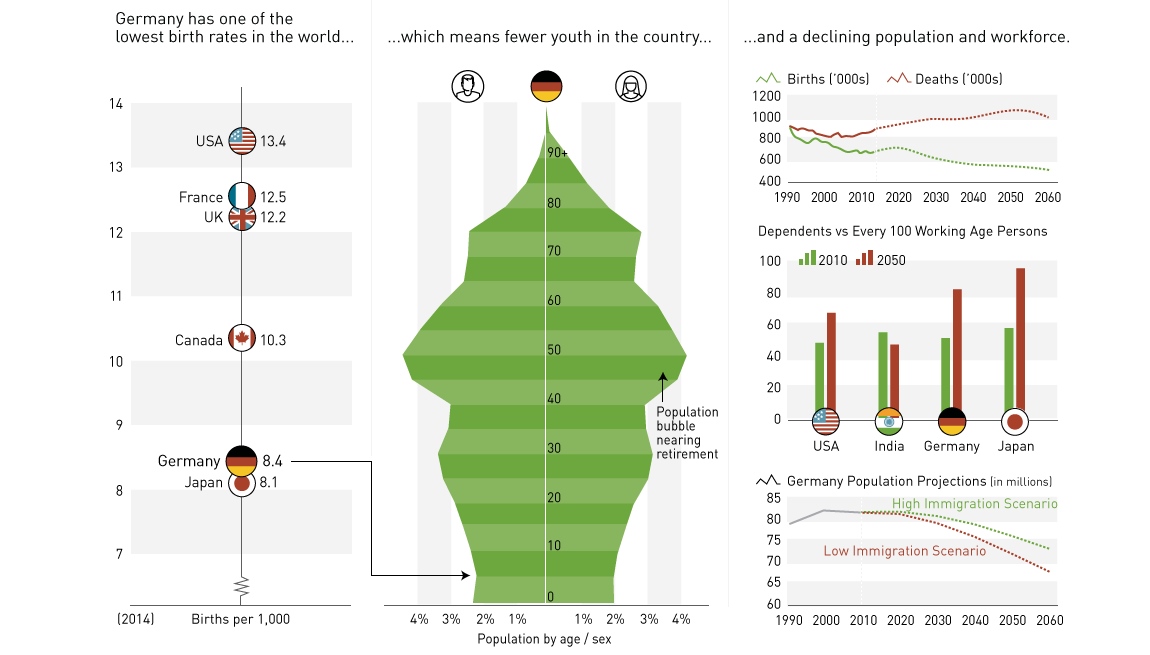
Germany’s Demographic Cliff [Chart]
Why Europe’s largest economy could be destined to be the next Japan
The Chart of the Week is a weekly Visual Capitalist feature on Fridays.
Last week’s chart showed that the world is turning Japanese with tales of economic malaise, extreme monetary policy, and negative rates. Germany, with its 5-yr government bond currently trading at a -0.33% yield, is no exception to this story.
However, negative yields are not the only concern that the country has in common with Japan. It’s the overall demographic picture that is worrying, and it could have a big effect on Germany’s economic future as well as the tough choices that must be made today.
Germany’s Importance
Germany is the most populous and productive economy in Europe, with 80 million people and a GDP of almost $4 trillion. It’s also the world’s third largest exporter, and that’s why it had the largest trade surplus globally in 2014 with $285 billion.
For all of its economic power, Germany has a key weakness that could potentially be its Achilles heel: it’s projected that Germany’s population will decline significantly over the coming decades, and the ratio of workers to dependents will become one of the worst in the world.
The Math
Every year, there are 8.4 births and 11.3 deaths per 1,000 people in Germany. The way this plays out over time is that the percentage of Germans under 15 will fall to 13% of the population by 2050, while the amount of people over 60 years old is to rise to 39%.
In the future, it is likely that there will not be enough youth or workers in the country. As Baby Boomers retire, there will be a larger burden placed on those paying into the government’s social safety net and other programs. Further, this widening gap will also mean a significant loss of experience, skill, and know-how in the workforce that will create coinciding economic challenges for the population.
In many Western nations, immigration plays a key role in keeping a population with low birth rates to be sustainable. However, in Germany’s case, both the high and low immigration scenarios look dire for future numbers. Germany’s state statistical authority currently projects a “high immigration” trend resulting in a drop to 73.1 million people by 2060, while a low-end estimate sees the population falling all the way to 67.6 million.
Choices
The U.N. projects that one in every six Germans will be over 80 years old by 2050. Are Germans comfortable with their nation remaining on this path?
If yes, then they must also be comfortable with a significant decrease in Germany’s economic role in the future. The country will almost certainly be on a more level stage with the U.K. and France, and it will have a diminished place on the world stage as Asia and Africa continue their rise. Tax rates will surge as a decreasing amount of workers pay into the system, and economic growth could stall in such a way that Germany has its own “Lost Decade”.
If no, then Germans must accept that there is only one realistic way to combat this trend: to open the immigration floodgates even more. While this is not what many Germans want to hear, especially as the current migrant and refugee crisis progresses, it is an option that must be weighed with careful consideration.
Either way, there are difficult choices to be made. How Germany proceeds with this question has implications both today and tomorrow on cultural, economic, and political levels.


Markets
The European Stock Market: Attractive Valuations Offer Opportunities
On average, the European stock market has valuations that are nearly 50% lower than U.S. valuations. But how can you access the market?


European Stock Market: Attractive Valuations Offer Opportunities
Europe is known for some established brands, from L’Oréal to Louis Vuitton. However, the European stock market offers additional opportunities that may be lesser known.
The above infographic, sponsored by STOXX, outlines why investors may want to consider European stocks.
Attractive Valuations
Compared to most North American and Asian markets, European stocks offer lower or comparable valuations.
| Index | Price-to-Earnings Ratio | Price-to-Book Ratio |
|---|---|---|
| EURO STOXX 50 | 14.9 | 2.2 |
| STOXX Europe 600 | 14.4 | 2 |
| U.S. | 25.9 | 4.7 |
| Canada | 16.1 | 1.8 |
| Japan | 15.4 | 1.6 |
| Asia Pacific ex. China | 17.1 | 1.8 |
Data as of February 29, 2024. See graphic for full index names. Ratios based on trailing 12 month financials. The price to earnings ratio excludes companies with negative earnings.
On average, European valuations are nearly 50% lower than U.S. valuations, potentially offering an affordable entry point for investors.
Research also shows that lower price ratios have historically led to higher long-term returns.
Market Movements Not Closely Connected
Over the last decade, the European stock market had low-to-moderate correlation with North American and Asian equities.
The below chart shows correlations from February 2014 to February 2024. A value closer to zero indicates low correlation, while a value of one would indicate that two regions are moving in perfect unison.
| EURO STOXX 50 | STOXX EUROPE 600 | U.S. | Canada | Japan | Asia Pacific ex. China |
|
|---|---|---|---|---|---|---|
| EURO STOXX 50 | 1.00 | 0.97 | 0.55 | 0.67 | 0.24 | 0.43 |
| STOXX EUROPE 600 | 1.00 | 0.56 | 0.71 | 0.28 | 0.48 | |
| U.S. | 1.00 | 0.73 | 0.12 | 0.25 | ||
| Canada | 1.00 | 0.22 | 0.40 | |||
| Japan | 1.00 | 0.88 | ||||
| Asia Pacific ex. China | 1.00 |
Data is based on daily USD returns.
European equities had relatively independent market movements from North American and Asian markets. One contributing factor could be the differing sector weights in each market. For instance, technology makes up a quarter of the U.S. market, but health care and industrials dominate the broader European market.
Ultimately, European equities can enhance portfolio diversification and have the potential to mitigate risk for investors.
Tracking the Market
For investors interested in European equities, STOXX offers a variety of flagship indices:
| Index | Description | Market Cap |
|---|---|---|
| STOXX Europe 600 | Pan-regional, broad market | €10.5T |
| STOXX Developed Europe | Pan-regional, broad-market | €9.9T |
| STOXX Europe 600 ESG-X | Pan-regional, broad market, sustainability focus | €9.7T |
| STOXX Europe 50 | Pan-regional, blue-chip | €5.1T |
| EURO STOXX 50 | Eurozone, blue-chip | €3.5T |
Data is as of February 29, 2024. Market cap is free float, which represents the shares that are readily available for public trading on stock exchanges.
The EURO STOXX 50 tracks the Eurozone’s biggest and most traded companies. It also underlies one of the world’s largest ranges of ETFs and mutual funds. As of November 2023, there were €27.3 billion in ETFs and €23.5B in mutual fund assets under management tracking the index.
“For the past 25 years, the EURO STOXX 50 has served as an accurate, reliable and tradable representation of the Eurozone equity market.”
— Axel Lomholt, General Manager at STOXX
Partnering with STOXX to Track the European Stock Market
Are you interested in European equities? STOXX can be a valuable partner:
- Comprehensive, liquid and investable ecosystem
- European heritage, global reach
- Highly sophisticated customization capabilities
- Open architecture approach to using data
- Close partnerships with clients
- Part of ISS STOXX and Deutsche Börse Group
With a full suite of indices, STOXX can help you benchmark against the European stock market.
Learn how STOXX’s European indices offer liquid and effective market access.

-

 Economy2 days ago
Economic Growth Forecasts for G7 and BRICS Countries in 2024
The IMF has released its economic growth forecasts for 2024. How do the G7 and BRICS countries compare?
-

 Markets1 week ago
U.S. Debt Interest Payments Reach $1 Trillion
U.S. debt interest payments have surged past the $1 trillion dollar mark, amid high interest rates and an ever-expanding debt burden.
-

 United States2 weeks ago
Ranked: The Largest U.S. Corporations by Number of Employees
We visualized the top U.S. companies by employees, revealing the massive scale of retailers like Walmart, Target, and Home Depot.
-

 Markets2 weeks ago
The Top 10 States by Real GDP Growth in 2023
This graphic shows the states with the highest real GDP growth rate in 2023, largely propelled by the oil and gas boom.
-

 Markets2 weeks ago
Ranked: The World’s Top Flight Routes, by Revenue
In this graphic, we show the highest earning flight routes globally as air travel continued to rebound in 2023.
-

 Markets3 weeks ago
Ranked: The Most Valuable Housing Markets in America
The U.S. residential real estate market is worth a staggering $47.5 trillion. Here are the most valuable housing markets in the country.


-

 Debt1 week ago
How Debt-to-GDP Ratios Have Changed Since 2000
-
Markets2 weeks ago
Ranked: The World’s Top Flight Routes, by Revenue
-

 Countries2 weeks ago
Population Projections: The World’s 6 Largest Countries in 2075
-
Markets2 weeks ago
The Top 10 States by Real GDP Growth in 2023
-

 Demographics2 weeks ago
The Smallest Gender Wage Gaps in OECD Countries
-

 United States2 weeks ago
Where U.S. Inflation Hit the Hardest in March 2024
-

 Green2 weeks ago
Top Countries By Forest Growth Since 2001
-
United States2 weeks ago
Ranked: The Largest U.S. Corporations by Number of Employees