Markets
Visualized: FTX’s Leaked Balance Sheet


Visualizing FTX’s Balance Sheet Before Bankruptcy
In a difficult year for the crypto space that has been full of hacks, failing funds, and decentralized stablecoins going to zero, nothing has compared to FTX and Sam Bankman-Fried’s (SBF) rapid implosion.
After an astronomical rise in the crypto space over the past three years, crypto exchange FTX and its founder and CEO SBF have come crashing back down to earth, largely unraveled by their misuse of customer funds and illicit relationship with trading firm Alameda Research.
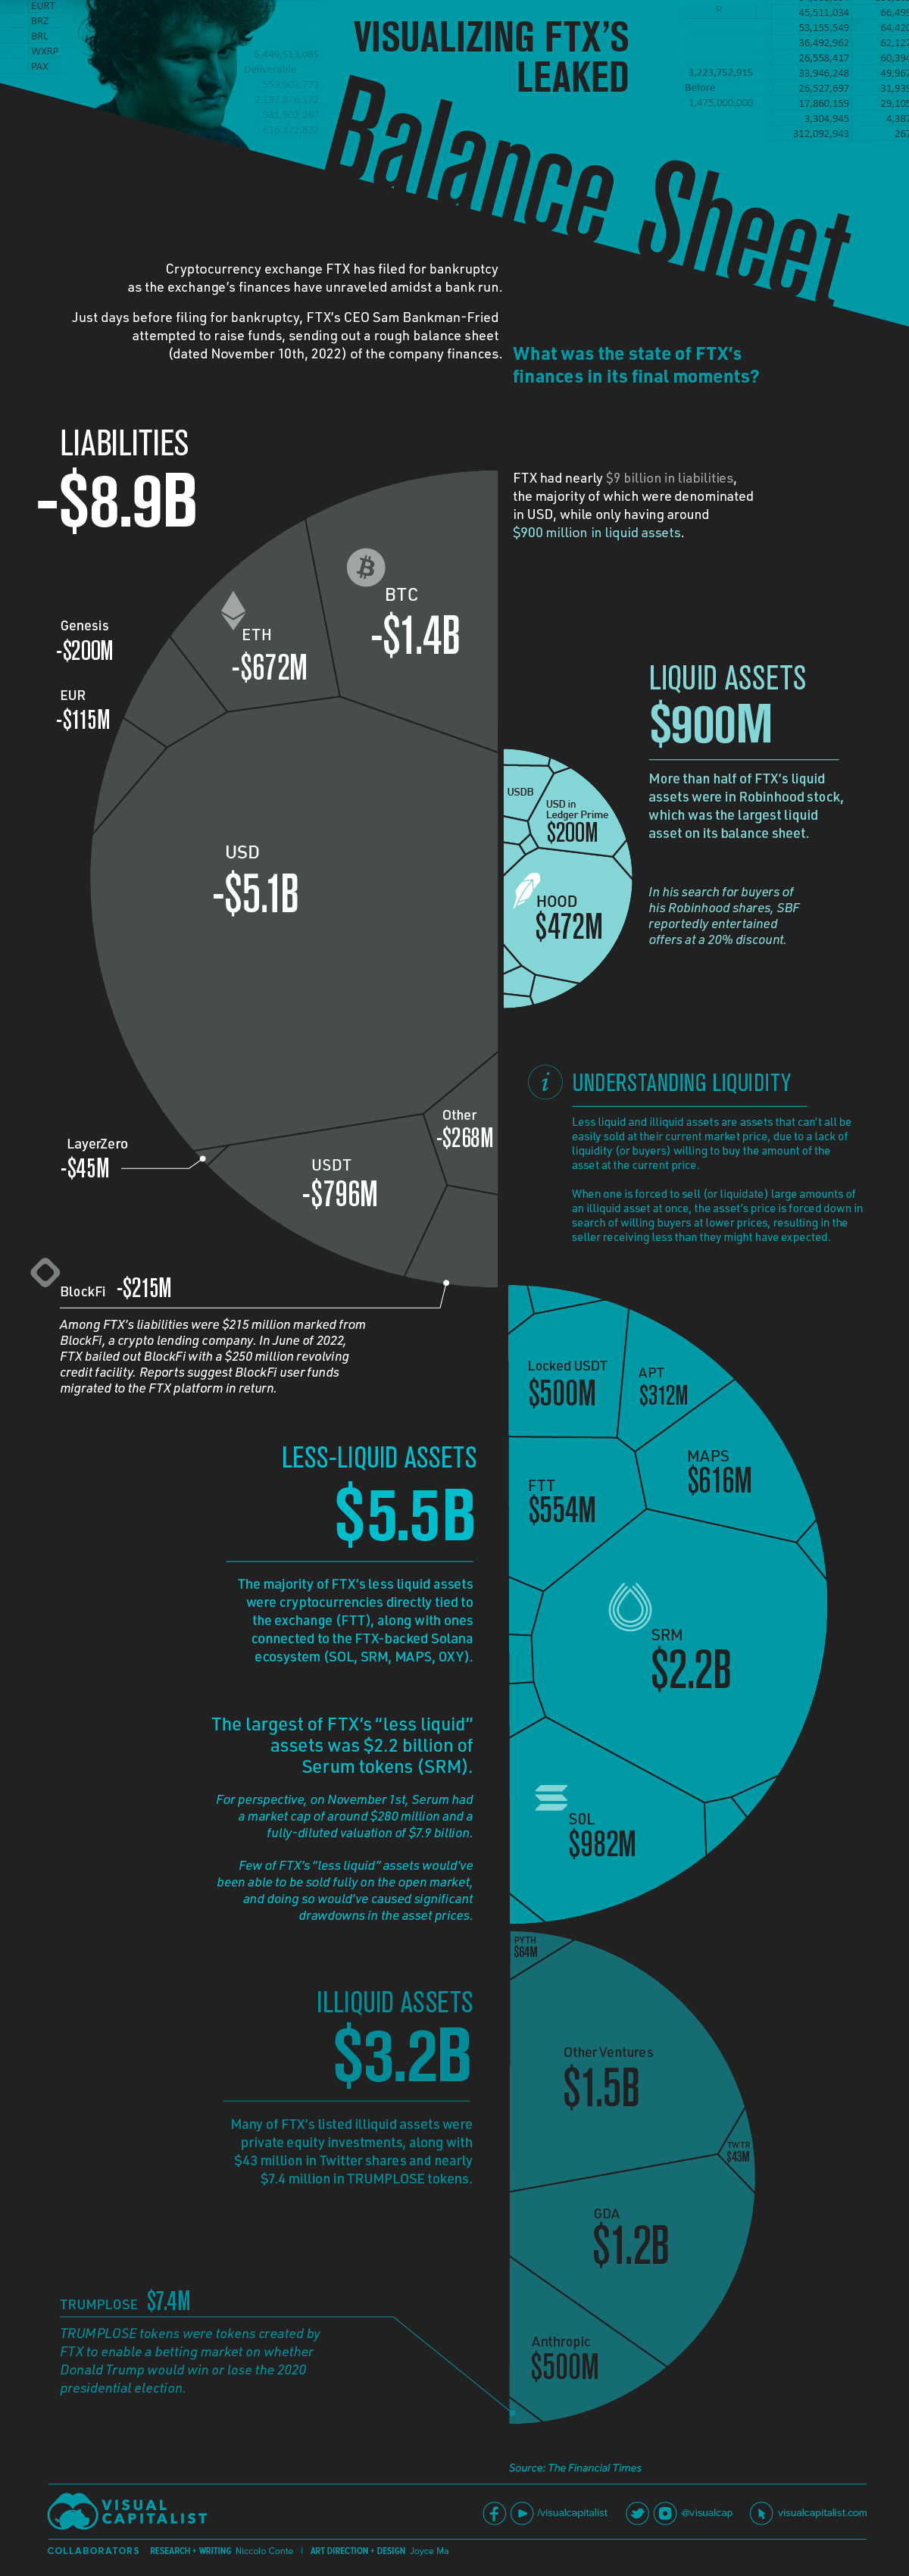
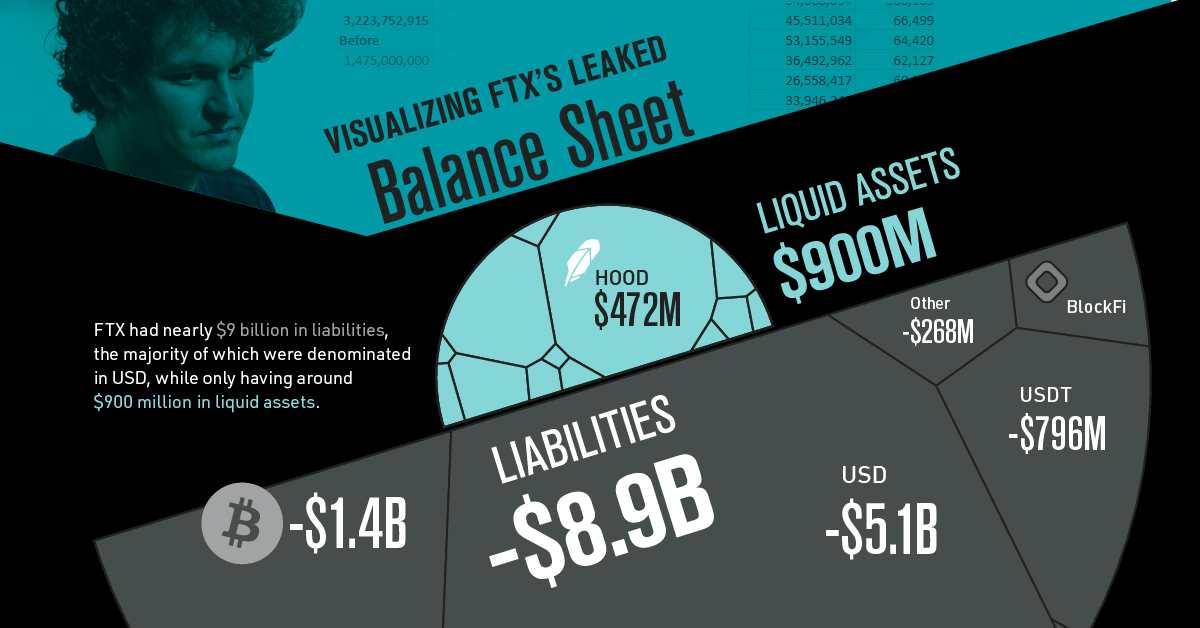
This graphic visualizes FTX’s leaked balance sheet dated to November 10th, and published by the Financial Times on November 12th. The spreadsheet shows nearly $9 billion in liabilities and not nearly enough illiquid cryptocurrency assets to cover the hole.
How did FTX wind up in this position?
How FTX’s Bankruptcy Unfolded
FTX’s eventual bankruptcy was sparked by a report on November 2nd by CoinDesk citing Alameda Research’s balance sheet. The article reported Alameda’s assets to be $14.6 billion, including $3.66 billion worth of unlocked FTT and $2.16 billion of FTT collateral.
With more than one-third of Alameda’s assets tied up in FTX’s exchange token FTT (including loans backed by the token), eyebrows were raised among the crypto community.
Four days later on November 6th, Alameda Research’s CEO, Caroline Ellison, and Sam Bankman-Fried addressed the CoinDesk story as unfounded rumors. However, on the same day, Binance CEO Changpeng Zhao (CZ) announced that Binance had decided to liquidate all remaining FTT on their books, kicking off a -7.6% decline in the FTT token on the day.
Back and Forth with Binance’s CZ
While Ellison publicly offered to buy CZ’s FTT directly “over the counter” to avoid further price declines and SBF claimed in a now-deleted tweet that “FTX is fine. Assets are fine.”, FTX users were withdrawing their funds from the exchange.
Less than 24 hours later on November 7th, both SBF and CZ tweeted that Binance had signed a non-binding letter of intent for the acquisition of FTX, pending due diligence.
The next day, the acquisition fell apart as Binance cited corporate due diligence, leaving SBF to face a multi-directional liquidity crunch of users withdrawing funds and rapidly declining token prices that made up large amounts of FTX and Alameda’s assets and collateral for loans.
FTX’s Liabilities and Largely Illiquid Assets
In the final days before declaring bankruptcy, FTX CEO Sam Bankman-Fried attempted a final fundraising in order restore stability while billions in user funds were being withdrawn from his exchange.
The balance sheet he sent around to prospective investors was leaked by the Financial Times, and reveals the exchange had nearly $9 billion in liabilities while only having just over $1 billion in liquid assets. Alongside the liquid assets were $5.4 billion in assets labeled as “less liquid” and $3.2 billion labeled as “illiquid”.
When examining the assets listed, FTX’s accounting appears to be poorly done at best, and fraudulently deceptive at worst.
Of those “less liquid” assets, many of the largest sums were in assets like FTX’s own exchange token and cryptocurrencies of the Solana ecosystem, which were heavily supported by FTX and Sam Bankman-Fried. On top of this, for many of these coins the liquidity simply wouldn’t have been there if FTX had attempted to redeem these cryptocurrencies for U.S. dollars or stablecoin equivalents.
While the liquid and less liquid assets on the balance sheet amounted to $6.3 billion (still not enough to equal the $8.9 billion in liabilities), many of these “less liquid” assets may as well have been completely illiquid.
Relationship with Alameda Research
When looking at FTX’s financials in isolation, it’s impossible to understand how one of crypto’s largest exchanges ended up with such a lopsided and illiquid balance sheet. Many of the still unfolding details lie in the exchange’s relationship with SBF’s previous venture that he founded, trading firm Alameda Research.
Founded by SBF in 2017, Alameda Research primarily operated as a delta-neutral (a term that describes trading strategies like market making and arbitrage that attempt to avoid taking directional risk) trading firm. In the summer of 2021, SBF stepped down from Alameda Research to focus on FTX, however his influence and connection with the firm was still deeply ingrained.
A report from the Wall Street Journal cites how Alameda was able to amass crypto tokens ahead of their announced public FTX listings, which were often catalysts in price surges. Alongside this, a Reuters story has revealed how SBF secretly moved $10 billion in funds to Alameda, using a bookkeeping “back door” to avoid internal scrutiny at FTX.
While SBF responded to the Reuters story by saying they “had confusing internal labeling and misread it,” there are few doubts that this murky relationship between Alameda Research and FTX was a fatal one for the former billionaire’s empire.


Markets
Mapped: Europe’s GDP Per Capita, by Country
Which European economies are richest on a GDP per capita basis? This map shows the results for 44 countries across the continent.


Mapped: Europe’s GDP Per Capita, by Country (2024)
This was originally posted on our Voronoi app. Download the app for free on iOS or Android and discover incredible data-driven charts from a variety of trusted sources.
Europe is home to some of the largest and most sophisticated economies in the world. But how do countries in the region compare with each other on a per capita productivity basis?
In this map, we show Europe’s GDP per capita levels across 44 nations in current U.S. dollars. Data for this visualization and article is sourced from the International Monetary Fund (IMF) via their DataMapper tool, updated April 2024.
Europe’s Richest and Poorest Nations, By GDP Per Capita
Luxembourg, Ireland, and Switzerland, lead the list of Europe’s richest nations by GDP per capita, all above $100,000.
| Rank | Country | GDP Per Capita (2024) |
|---|---|---|
| 1 | 🇱🇺 Luxembourg | $131,380 |
| 2 | 🇮🇪 Ireland | $106,060 |
| 3 | 🇨🇭 Switzerland | $105,670 |
| 4 | 🇳🇴 Norway | $94,660 |
| 5 | 🇮🇸 Iceland | $84,590 |
| 6 | 🇩🇰 Denmark | $68,900 |
| 7 | 🇳🇱 Netherlands | $63,750 |
| 8 | 🇸🇲 San Marino | $59,410 |
| 9 | 🇦🇹 Austria | $59,230 |
| 10 | 🇸🇪 Sweden | $58,530 |
| 11 | 🇧🇪 Belgium | $55,540 |
| 12 | 🇫🇮 Finland | $55,130 |
| 13 | 🇩🇪 Germany | $54,290 |
| 14 | 🇬🇧 UK | $51,070 |
| 15 | 🇫🇷 France | $47,360 |
| 16 | 🇦🇩 Andorra | $44,900 |
| 17 | 🇲🇹 Malta | $41,740 |
| 18 | 🇮🇹 Italy | $39,580 |
| 19 | 🇨🇾 Cyprus | $37,150 |
| 20 | 🇪🇸 Spain | $34,050 |
| 21 | 🇸🇮 Slovenia | $34,030 |
| 22 | 🇪🇪 Estonia | $31,850 |
| 23 | 🇨🇿 Czech Republic | $29,800 |
| 24 | 🇵🇹 Portugal | $28,970 |
| 25 | 🇱🇹 Lithuania | $28,410 |
| 26 | 🇸🇰 Slovakia | $25,930 |
| 27 | 🇱🇻 Latvia | $24,190 |
| 28 | 🇬🇷 Greece | $23,970 |
| 29 | 🇭🇺 Hungary | $23,320 |
| 30 | 🇵🇱 Poland | $23,010 |
| 31 | 🇭🇷 Croatia | $22,970 |
| 32 | 🇷🇴 Romania | $19,530 |
| 33 | 🇧🇬 Bulgaria | $16,940 |
| 34 | 🇷🇺 Russia | $14,390 |
| 35 | 🇹🇷 Türkiye | $12,760 |
| 36 | 🇲🇪 Montenegro | $12,650 |
| 37 | 🇷🇸 Serbia | $12,380 |
| 38 | 🇦🇱 Albania | $8,920 |
| 39 | 🇧🇦 Bosnia & Herzegovina | $8,420 |
| 40 | 🇲🇰 North Macedonia | $7,690 |
| 41 | 🇧🇾 Belarus | $7,560 |
| 42 | 🇲🇩 Moldova | $7,490 |
| 43 | 🇽🇰 Kosovo | $6,390 |
| 44 | 🇺🇦 Ukraine | $5,660 |
| N/A | 🇪🇺 EU Average | $44,200 |
Note: Figures are rounded.
Three Nordic countries (Norway, Iceland, Denmark) also place highly, between $70,000-90,000. Other Nordic peers, Sweden and Finland rank just outside the top 10, between $55,000-60,000.
Meanwhile, Europe’s biggest economies in absolute terms, Germany, UK, and France, rank closer to the middle of the top 20, with GDP per capitas around $50,000.
Finally, at the end of the scale, Eastern Europe as a whole tends to have much lower per capita GDPs. In that group, Ukraine ranks last, at $5,660.
A Closer Look at Ukraine
For a broader comparison, Ukraine’s per capita GDP is similar to Iran ($5,310), El Salvador ($5,540), and Guatemala ($5,680).
According to experts, Ukraine’s economy has historically underperformed to expectations. After the fall of the Berlin Wall, the economy contracted for five straight years. Its transition to a Western, liberalized economic structure was overshadowed by widespread corruption, a limited taxpool, and few revenue sources.
Politically, its transformation from authoritarian regime to civil democracy has proved difficult, especially when it comes to institution building.
Finally, after the 2022 invasion of the country, Ukraine’s GDP contracted by 30% in a single year—the largest loss since independence. Large scale emigration—to the tune of six million refugees—is also playing a role.
Despite these challenges, the country’s economic growth has somewhat stabilized while fighting continues.

-

 Markets5 days ago
Visualizing Global Inflation Forecasts (2024-2026)
-

 Green2 weeks ago
The Carbon Footprint of Major Travel Methods
-

 United States2 weeks ago
Visualizing the Most Common Pets in the U.S.
-

 Culture2 weeks ago
The World’s Top Media Franchises by All-Time Revenue
-

 voronoi1 week ago
Best Visualizations of April on the Voronoi App
-

 Wealth1 week ago
Charted: Which Country Has the Most Billionaires in 2024?
-

 Business1 week ago
The Top Private Equity Firms by Country
-

 Markets1 week ago
The Best U.S. Companies to Work for According to LinkedIn