Technology
From Amazon to Zoom: What Happens in an Internet Minute In 2021?
From Amazon to Zoom: An Internet Minute In 2021
In our everyday lives, not much may happen in a minute. But when gauging the depth of internet activity occurring all at once, it can be extraordinary. Today, around five billion internet users exist across the globe.
This annual infographic from Domo captures just how much activity is going on in any given minute, and the amount of data being generated by users. To put it mildly, there’s a lot.
The Internet Minute
At the heart of the world’s digital activity are the everyday services and applications that have become staples in our lives. Collectively, these produce unimaginable quantities of user activity and associated data.
Here are just some of the key figures of what happens in a minute:
- Amazon customers spend $283,000
- 12 million people send an iMessage
- 6 million people shop online
- Instacart users spend $67,000
- Slack users send 148,000 messages
- Microsoft Teams connects 100,000 users
- YouTube users stream 694,000 videos
- Facebook Live receives 44 million views
- Instagram users share 65,000 photos
- Tiktok users watch 167 million videos
As these facts show, Big Tech companies have quite the influence over our lives. That influence is becoming difficult to ignore, and draws increasing media and political attention. And some see this attention as a plausible explanation for why Facebook changed their name—to dissociate from their old one in the process.
One tangible measure of this influence is the massive amount of revenue Big Tech companies bring in. To get a better sense of this, we can look at Big Tech’s revenue generating capabilities on a per-minute basis as well:
| Company | Revenue Per Minute |
|---|---|
| Amazon | $955,517 |
| Apple | $848,090 |
| Alphabet (Google) | $433,014 |
| Microsoft | $327,823 |
| $213,628 | |
| Tesla | $81,766 |
| Netflix | $50,566 |
Much of the revenue that these elite trillion-dollar stocks generate can be traced back to all the activity on their various networks and platforms.
In other words, the 5.7 million Google searches that occur every minute is the key to their $433,014 in per minute sales.
The Internet Minute Over The Years
With the amount of data and information in the digital universe effectively doubling every two years, it’s fair to say the internet minute has gone through some changes over the years. Here are just some areas that have experienced impressive growth:
- In 2016, Snapchat users 527k photos per minute, compared to 2 million in 2021
- In 2017, Twitter saw 452k Tweets per minute, compared to 575k in 2021
- In 2018, $862,823 was spent online shopping, while 2 million people were shopping per minute in 2021
- In 2019, 4.5 million videos on YouTube were being viewed every minute, while in 2021 users were streaming 694k hours
- In 2020, Netflix users streamed 404k hours per minute, growing to 452k hours in 2021
Here’s a look at the services that have been featured in the various iterations of this graphic over the years:
Twitter, Instagram, and Youtube are the only three brands to be featured every single year.
Internet Growth Perspectives
The Internet Minute wheel also helps to put the internet’s rapid rate of adoption into perspective. For instance, in 1993, there were only 14 million internet users across the globe. But today, there are over 14 million just in Chile.
That said, the total addressable market still has some room left. By some measures, the complete number of internet users grew by 500 million in 2021, a roughly 11% jump from 4.5 billion users in 2020. This comes out to an astonishing 950 new users on a per minute basis.
What’s more, in the long term, with the appropriate infrastructure in place, certain areas within emerging markets can experience buoyant growth in the number of connected citizens. Here’s where the next billion internet users may come from, based on the largest disconnected populations.
| Rank | Country / Territory | Unconnected People | % of Population |
|---|---|---|---|
| 1 | India | 685,591,071 | 50% |
| 2 | China | 582,063,733 | 41% |
| 3 | Pakistan | 142,347,735 | 65% |
| 4 | Nigeria | 118,059,925 | 58% |
| 5 | Bangladesh | 97,427,352 | 59% |
| 6 | Indonesia | 96,709,226 | 36% |
| 7 | Ethiopia | 92,385,728 | 81% |
| 8 | Democratic Republic of Congo | 71,823,319 | 81% |
| 9 | Brazil | 61,423,295 | 29% |
| 10 | Egypt | 46,626,170 | 46% |
With this growth trajectory in mind, we can expect future figures to become even more astonishing. But the human mind is known to be bad at interpreting large numbers, so in future editions, the internet minute figures may need to be stripped down to the internet second.


Technology
Charting the Next Generation of Internet
In this graphic, Visual Capitalist has partnered with MSCI to explore the potential of satellite internet as the next generation of internet innovation.
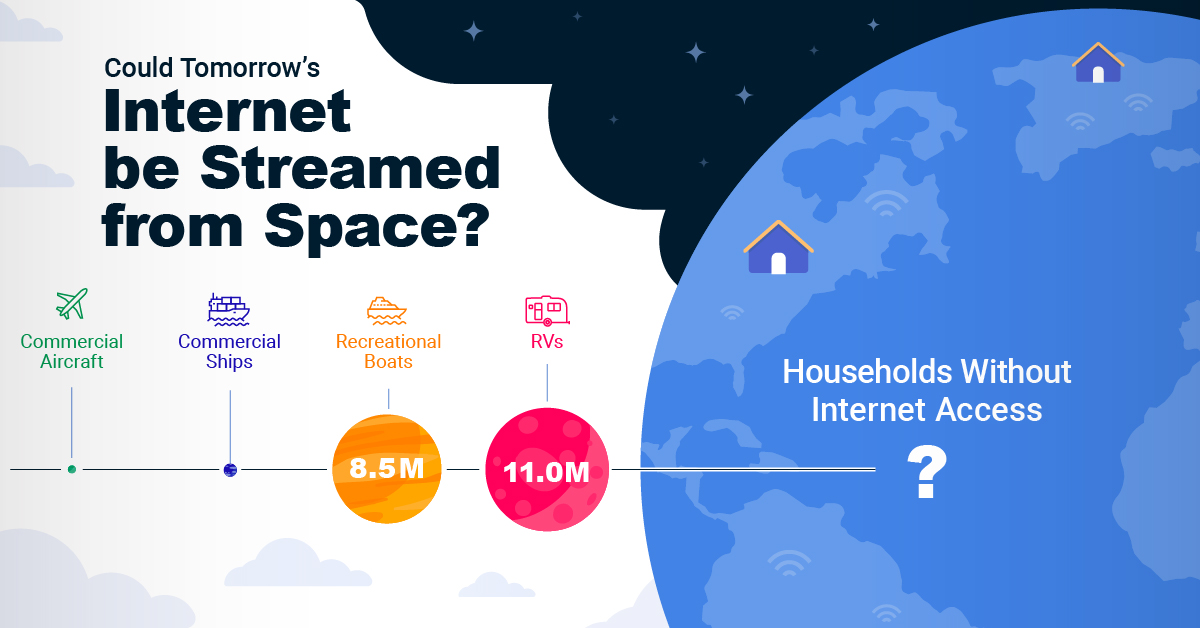

Could Tomorrow’s Internet be Streamed from Space?
In 2023, 2.6 billion people could not access the internet. Today, companies worldwide are looking to innovative technology to ensure more people are online at the speed of today’s technology.
Could satellite internet provide the solution?
In collaboration with MSCI, we embarked on a journey to explore whether tomorrow’s internet could be streamed from space.
Satellite Internet’s Potential Customer Base
Millions of people live in rural communities or mobile homes, and many spend much of their lives at sea or have no fixed abode. So, they cannot access the internet simply because the technology is unavailable.
Satellite internet gives these communities access to the internet without requiring a fixed location. Consequently, the volume of people who could get online using satellite internet is significant:
| Area | Potential Subscribers |
|---|---|
| Households Without Internet Access | 600,000,000 |
| RVs | 11,000,000 |
| Recreational Boats | 8,500,000 |
| Ships | 100,000 |
| Commercial Aircraft | 25,000 |
Advances in Satellite Technology
Satellite internet is not a new concept. However, it has only recently been that roadblocks around cost and long turnaround times have been overcome.
NASA’s space shuttle, until it was retired in 2011, was the only reusable means of transporting crew and cargo into orbit. It cost over $1.5 billion and took an average of 252 days to launch and refurbish.
In stark contrast, SpaceX’s Falcon 9 can now launch objects into orbit and maintain them at a fraction of the time and cost, less than 1% of the space shuttle’s cost.
| Average Rocket Turnaround Time | Average Launch/Refurbishment Cost | |
|---|---|---|
| Falcon 9* | 21 days | < $1,000,000 |
| Space Shuttle | 252 days | $1,500,000,000 (approximately) |
Satellites are now deployed 300 miles in low Earth orbit (LEO) rather than 22,000 miles above Earth in Geostationary Orbit (GEO), previously the typical satellite deployment altitude.
What this means for the consumer is that satellite internet streamed from LEO has a latency of 40 ms, which is an optimal internet connection. Especially when compared to the 700 ms stream latency experienced with satellite internet streamed from GEO.
What Would it Take to Build a Satellite Internet?
SpaceX, the private company that operates Starlink, currently has 4,500 satellites. However, the company believes it will require 10 times this number to provide comprehensive satellite internet coverage.
Charting the number of active satellites reveals that, despite the increasing number of active satellites, many more must be launched to create a comprehensive satellite internet.
| Year | Number of Active Satellites |
|---|---|
| 2022 | 6,905 |
| 2021 | 4,800 |
| 2020 | 3,256 |
| 2019 | 2,272 |
| 2018 | 2,027 |
| 2017 | 1,778 |
| 2016 | 1,462 |
| 2015 | 1,364 |
| 2014 | 1,262 |
| 2013 | 1,187 |
Next-Generation Internet Innovation
Innovation is at the heart of the internet’s next generation, and the MSCI Next Generation Innovation Index exposes investors to companies that can take advantage of potentially disruptive technologies like satellite internet.
You can gain exposure to companies advancing access to the internet with four indexes:
- MSCI ACWI IMI Next Generation Internet Innovation Index
- MSCI World IMI Next Generation Internet Innovation 30 Index
- MSCI China All Shares IMI Next Generation Internet Innovation Index
- MSCI China A Onshore IMI Next Generation Internet Innovation Index
MSCI thematic indexes are objective, rules-based, and regularly updated to focus on specific emerging trends that could evolve.
Click here to explore the MSCI thematic indexes

-

 Technology1 week ago
Countries With the Highest Rates of Crypto Ownership
While the U.S. is a major market for cryptocurrencies, two countries surpass it in terms of their rates of crypto ownership.
-

 Technology2 weeks ago
Mapped: The Number of AI Startups By Country
Over the past decade, thousands of AI startups have been funded worldwide. See which countries are leading the charge in this map graphic.
-

 Technology3 weeks ago
All of the Grants Given by the U.S. CHIPS Act
Intel, TSMC, and more have received billions in subsidies from the U.S. CHIPS Act in 2024.
-

 Technology3 weeks ago
Visualizing AI Patents by Country
See which countries have been granted the most AI patents each year, from 2012 to 2022.
-

 Technology4 weeks ago
How Tech Logos Have Evolved Over Time
From complete overhauls to more subtle tweaks, these tech logos have had quite a journey. Featuring: Google, Apple, and more.
-

 AI1 month ago
Ranked: Semiconductor Companies by Industry Revenue Share
Nvidia is coming for Intel’s crown. Samsung is losing ground. AI is transforming the space. We break down revenue for semiconductor companies.


-

 Personal Finance1 week ago
Visualizing the Tax Burden of Every U.S. State
-

 Misc6 days ago
Visualized: Aircraft Carriers by Country
-

 Culture7 days ago
How Popular Snack Brand Logos Have Changed
-

 Mining1 week ago
Visualizing Copper Production by Country in 2023
-

 Misc1 week ago
Charted: How Americans Feel About Federal Government Agencies
-

 Healthcare1 week ago
Which Countries Have the Highest Infant Mortality Rates?
-

 Demographics1 week ago
Mapped: U.S. Immigrants by Region
-

 Maps1 week ago
Mapped: Southeast Asia’s GDP Per Capita, by Country