Gold
Crisis Investing: How 14 Different Asset Classes Performed in Times of Distress
Crisis Investing: How 14 Different Asset Classes Performed in Times of Distress
Note: to see the bigger version of this infographic, click here.
History does not repeat itself, but it often rhymes. This could not be truer for crisis investing.
Between China’s stock market and the debt troubles of Greece and Puerto Rico, it is clear that we could be entering a time of potential financial crisis.
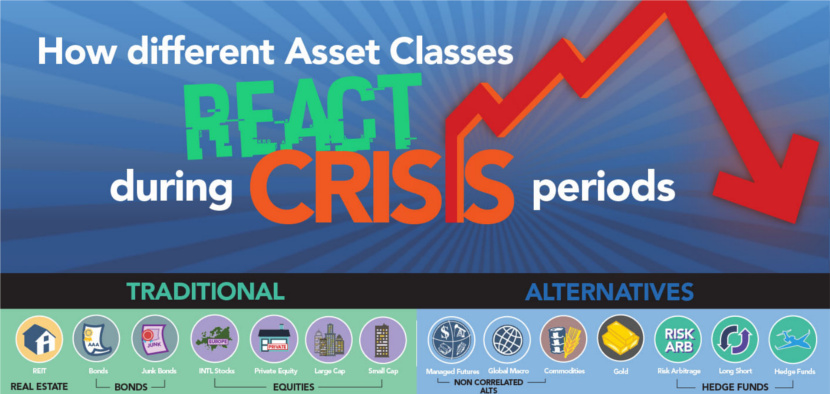
Every situation is unique, but generally the types of asset classes that protect investors in times of crisis are not necessarily the same as those during a bull run. Therefore, it’s worth taking a look at five previous periods of distress to see the returns of conventional and alternative asset classes.
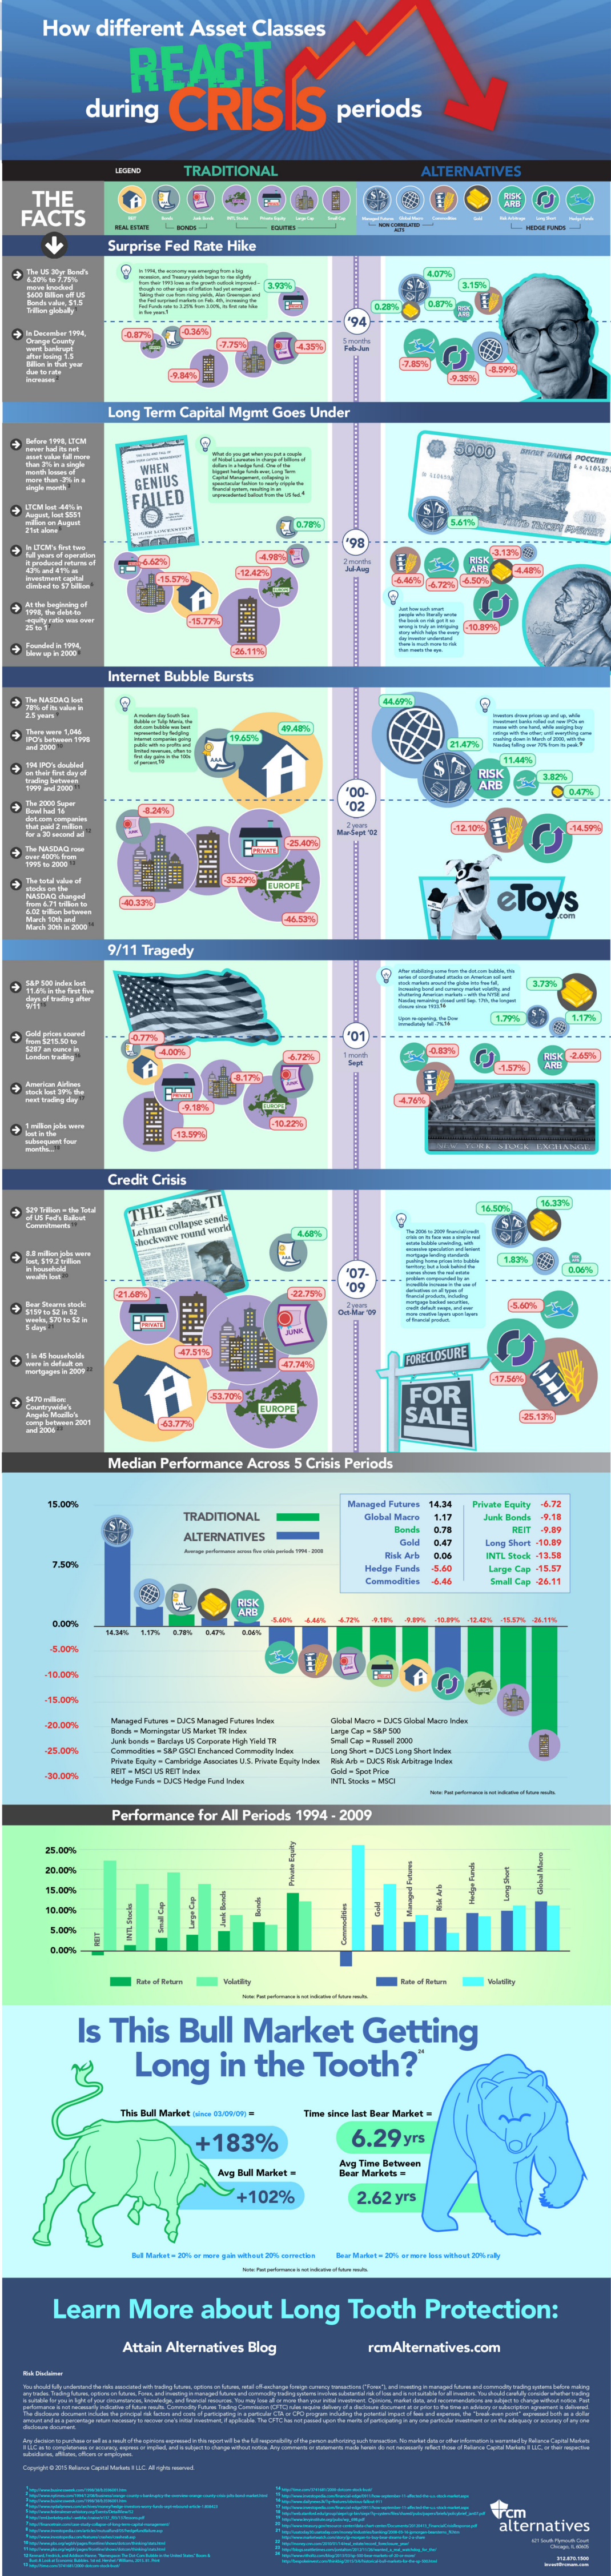
1994: Surprise Rate Hike
In 1994, the economy was recovering from a significant recession and treasury yields started to rise from the lows of the previous year. The Fed and Alan Greenspan surprised markets by tightening monetary policy with the first rate hike in five years.
Returns: Large cap (-7.75%) and small cap stocks (-9.84%) got crushed. Managed futures (4.07%), commodities (3.15%), and gold (0.28%) did okay.
1998: LTCM Goes Under
Long-Term Capital Management started off with promise as it brought in annualized returns (after fees) of 21%, 43%, and 41% in its first three years with high leverage and normal macroeconomic conditions. LTCM directors Myron Scholes and Robert Merton would share the Nobel Prize in Economic Sciences in 1997. Promptly after, the hedge fund would lose $4.6 billion in four months in the aftermath of the Asian financial crisis, requiring a bailout from the Federal Reserve and various banks.
Returns: Stocks and REITs get crushed. Bonds (0.78%) and managed futures (5.61%) survive.
2000: Dotcom Bubble Bursts
Fledgling internet companies with no profits and limited revenues went public, reaping huge gains on IPOs. Prices went up and up, but eventually came crashing down in March of 2000 with the Nasdaq losing up to 70% of its peak value.
Returns: Large cap stocks (-40.33%), small cap stocks (-35.29%), private equity (-25.40%), and international stocks (-46.53%) get hammered. REITs (49.48%), bonds (19.65%), global macro (44.69%) all did well. Gold (0.47%) remained virtually unchanged.
2001: 9/11 Tragedy
Coordinated attacks on the United States shock markets, and the NYSE and Nasdaq remain closed until September 17th. Upon re-opening, the Dow drops 7%.
Returns: Almost all asset classes struggle, but gold (3.73%) got the highest return.
2008: Global Financial Crisis
Lehman Brothers goes under and the Greenspan real estate bubble crashes and burns. Excessive speculation, lenient mortgage lending, and the proliferation of derivative financial products such as credit default swaps contribute to the problem. The Fed has $29 trillion in bailout commitments while 8.8 million jobs and $19.2 trillion in household wealth are lost.
Returns: Again, most assets get crushed. It is no surprise that worst off are REITs (-63.77%). Gold continues to shine, gaining double digits (16.33%).
Original graphic by: Attain Capital


Mining
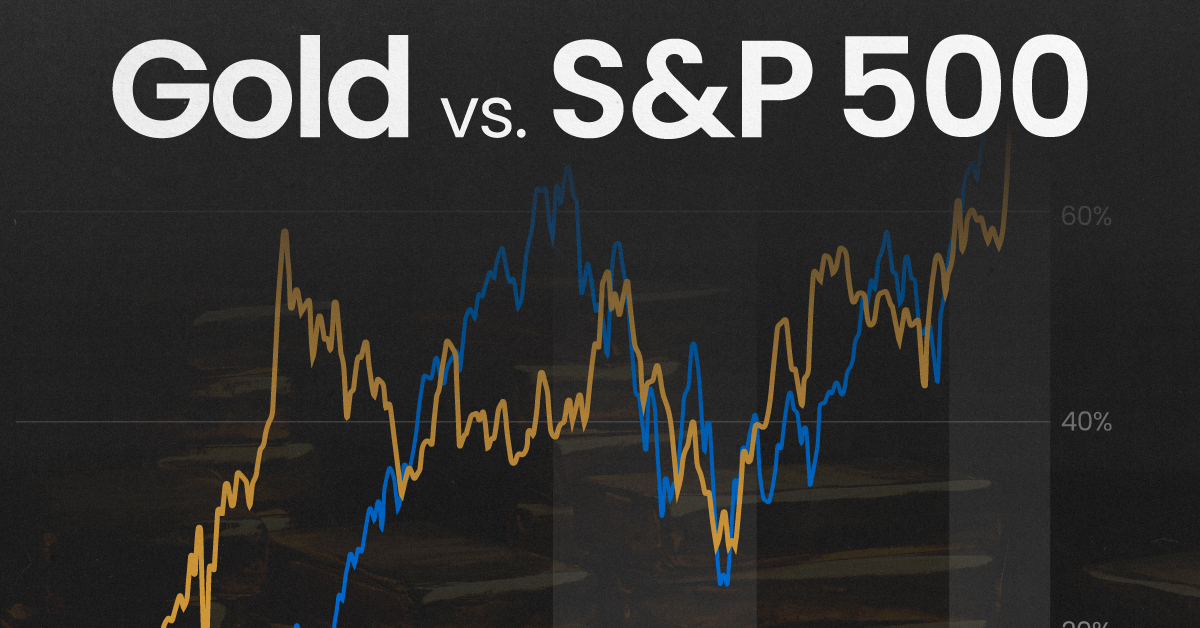
Gold vs. S&P 500: Which Has Grown More Over Five Years?
The price of gold has set record highs in 2024, but how has this precious metal performed relative to the S&P 500?

Gold vs. S&P 500: Which Has Grown More Over Five Years?
This was originally posted on our Voronoi app. Download the app for free on Apple or Android and discover incredible data-driven charts from a variety of trusted sources.
Gold is considered a unique asset due to its enduring value, historical significance, and application in various technologies like computers, spacecraft, and communications equipment.
Commonly regarded as a “safe haven asset”, gold is something investors typically buy to protect themselves during periods of global uncertainty and economic decline.
It is for this reason that gold has performed rather strongly in recent years, and especially in 2024. Persistent inflation combined with multiple wars has driven up demand for gold, helping it set a new all-time high of over $2,400 per ounce.
To put this into perspective, we visualized the performance of gold alongside the S&P 500. See the table below for performance figures as of April 12, 2024.
| Asset/Index | 1 Yr (%) | 5 Yr (%) |
|---|---|---|
| 🏆 Gold | +16.35 | +81.65 |
| 💼 S&P 500 | +25.21 | +76.22 |
Over the five-year period, gold has climbed an impressive 81.65%, outpacing even the S&P 500.
Get Your Gold at Costco
Perhaps a sign of how high the demand for gold is becoming, wholesale giant Costco is reportedly selling up to $200 million worth of gold bars every month in the United States. The year prior, sales only amounted to $100 million per quarter.
Consumers aren’t the only ones buying gold, either. Central banks around the world have been accumulating gold in very large quantities, likely as a hedge against inflation.
According to the World Gold Council, these institutions bought 1,136 metric tons in 2022, marking the highest level since 1950. Figures for 2023 came in at 1,037 metric tons.
See More Graphics on Gold
If you’re fascinated by gold, be sure to check out more Visual Capitalist content including 200 Years of Global Gold Production, by Country or Ranked: The Largest Gold Reserves by Country.

-

 Mining1 week ago
Gold vs. S&P 500: Which Has Grown More Over Five Years?
-

 Markets2 weeks ago
Ranked: The Most Valuable Housing Markets in America
-

 Money2 weeks ago
Which States Have the Highest Minimum Wage in America?
-

 AI2 weeks ago
Ranked: Semiconductor Companies by Industry Revenue Share
-

 Markets2 weeks ago
Ranked: The World’s Top Flight Routes, by Revenue
-

 Countries2 weeks ago
Population Projections: The World’s 6 Largest Countries in 2075
-

 Markets2 weeks ago
The Top 10 States by Real GDP Growth in 2023
-

 Demographics2 weeks ago
The Smallest Gender Wage Gaps in OECD Countries