Culture
Animated Chart: The Rise and Fall of Music Sales, by Format (1973-2021)
Article/Editing:
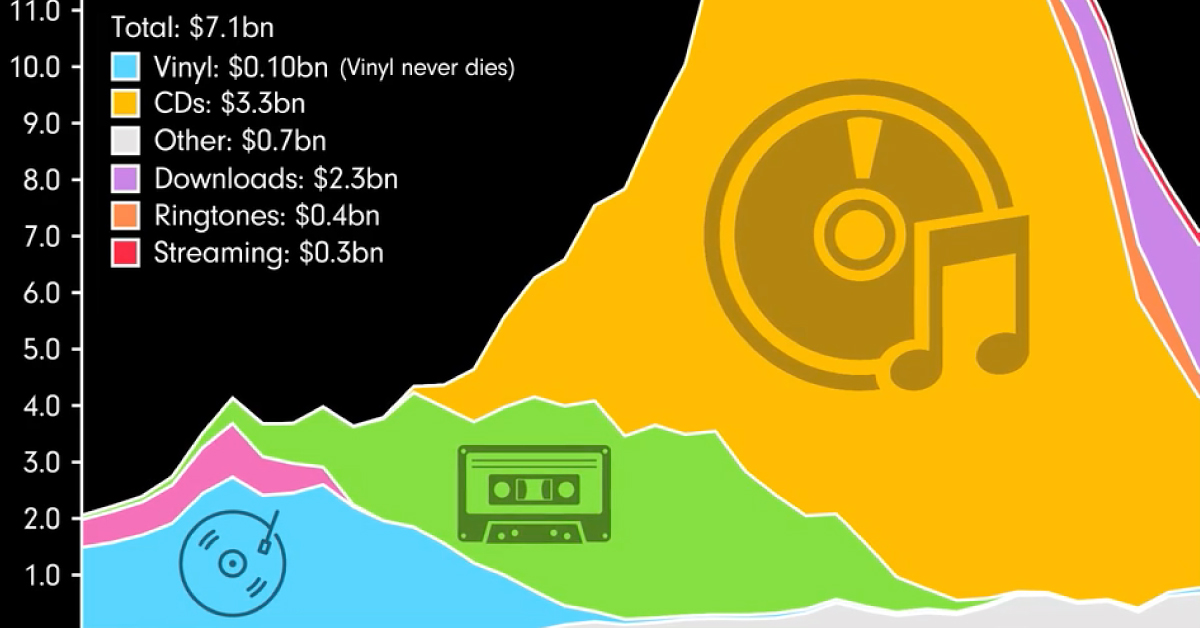
The Rise and Fall of Music Sales, by Format (1973-2021)
We live in a world of music. Whether when driving to work or jamming out at home, people around the world like to have their favorite tunes playing in the background.
But while our love for music has been constant, the way we consume media has evolved drastically. The past 50 years have seen many different music formats used to access these tunes, mirroring society’s shift from analog to digital.
This video, created by James Eagle using data from the Recording Industry Association of America (RIAA), highlights sales of different music formats in the U.S. over the last 50 years.
Vinyl
Up until the late 1980s, vinyl dominated the music format industry, earning billions of dollars in sales annually. Records of Bruce Springsteen’s Born to Run or Pink Floyd’s Dark Side of the Moon were some of the top selling albums available.
Vinyl is said to provide its listeners with analog sounds that reverberate and the warm notes of almost-live music. For vinyl users and enthusiasts to this day, the music produced by these sleek yet massive records is unparalleled.
8-Track
If you’re a millennial (or younger), you may have never heard of the 8-track. But this music format played an integral part in the history of music.
When the booming automotive vehicle industry found it challenging to translate the music experience to cars using vinyl, it looked to the “Stereo 8” eight-track cartridge, better known as the 8-track. This cartridge used an analog magnetic tape and provided 90 minutes of continuous music play time.
8-track carved a niche for itself much before the advent of cassettes and CDs. And through the proliferation of vehicles, 8-track sales climbed to reach a peak revenue of $900 million in 1978.
Cassettes
The era of cassettes pushed 8-tracks into the history of music in the early 1980s. These pocket-sized tapes were more convenient to use than 8Tracks and quickly spread worldwide.
By 1989, the cassette format reached its peak revenues of $3.7 billion.
CDs
First released in 1982, the Compact Disc or CD came into the music market as the successor to the vinyl record.
Developed by Philips and Sony, sales of the sleek and portable CD grew quickly as home and car stereos alike added CD functionality. The format brought in $13.3 billion in revenue in both 1999 and 2000. To date, no other music format has reached the same milestone since.
Digital Music Formats
When it comes to preferred music formats over time, convenience (and cost) seem to have been the biggest catalysts of change.
From the start of the early 2000s, CDs had started to be replaced by other forms of digital storage and distribution. The massive shift to internet consumption and the introduction of digital music, available through downloads, pushed audio CD sales down rapidly.
The launch of streaming platforms like Spotify in 2006 exacerbated this decline, with CD sales dropping by around $4 billion in five years.
Digital sales continued to evolve. Ringtone sales alone brought in $1.1 billion in 2007, and in 2012, the revenues from downloads shot up to a peak of $2.9 billion. But music streaming platforms kept climbing through 2021, and will likely continue to be the future face of music consumption.
| Rank | Music formats | Revenue in 2021 |
|---|---|---|
| 1 | Streaming | $11.5 billion |
| 2 | Vinyl | $1.0 billion |
| 3 | CD | $0.6 billion |
| 4 | Downloads | $0.5 billion |
| Other | $1.4 billion | |
| Total | $15.1 billion |
Music streaming and subscription services pushed the accessibility of music to new highs, especially with free ad-supported platforms.
In 2021, streaming secured the music industry a whopping $11.5 billion in sales, good for 76% of the total. If it keeps growing in popularity and accessibility, the format could potentially challenge the peak popularity of CDs in the late 90s.
The Vintage Comeback?
There’s no doubt that digital music formats are getting increasingly popular with every passing year. However, one of our vintage and beloved music formats—the vinyl record—seems to be making a comeback.
According to the RIAA database, the revenue earned by LP/EP sales has shot up to $1.0 billion in 2021, its highest total since the mid-1980s.

This article was published as a part of Visual Capitalist's Creator Program, which features data-driven visuals from some of our favorite Creators around the world.


Automotive
How People Get Around in America, Europe, and Asia
Examining how people get around using cars, public transit, and walking or biking, and the regional differences in usage.


How People Get Around in America, Europe, and Asia
This was originally posted on our Voronoi app. Download the app for free on iOS or Android and discover incredible data-driven charts from a variety of trusted sources.
This chart highlights the popularity of different transportation types in the Americas, Europe, and Asia, calculated by modal share.
Data for this article and visualization is sourced from ‘The ABC of Mobility’, a research paper by Rafael Prieto-Curiel (Complexity Science Hub) and Juan P. Ospina (EAFIT University), accessed through ScienceDirect.
The authors gathered their modal share data through travel surveys, which focused on the primary mode of transportation a person employs for each weekday trip. Information from 800 cities across 61 countries was collected for this study.
North American Car Culture Contrasts with the Rest of the World
In the U.S. and Canada, people heavily rely on cars to get around, no matter the size of the city. There are a few exceptions of course, such as New York, Toronto, and smaller college towns across the United States.
| Region | 🚗 Cars | 🚌 Public Transport | 🚶 Walking/Biking |
|---|---|---|---|
| North America* | 92% | 5% | 4% |
| Central America | 23% | 42% | 35% |
| South America | 29% | 40% | 31% |
| Northern Europe | 48% | 29% | 24% |
| Western Europe | 43% | 24% | 34% |
| Southern Europe | 50% | 24% | 25% |
| Eastern Europe | 35% | 40% | 25% |
| Southeastern Asia | 44% | 43% | 13% |
| Western Asia | 43% | 28% | 29% |
| Southern Asia | 22% | 39% | 39% |
| Eastern Asia | 19% | 46% | 35% |
| World | 51% | 26% | 22% |
Note: *Excluding Mexico. Percentages are rounded.
As a result, North America’s share of public transport and active mobility (walking and biking) is the lowest amongst all surveyed regions by a significant amount.
On the other hand, public transport reigns supreme in South and Central America as well as Southern and Eastern Asia. It ties with cars in Southeastern Asia, and is eclipsed by cars in Western Asia.
As outlined in the paper, Europe sees more city-level differences in transport popularity.
For example, Utrecht, Netherlands prefers walking and biking. People in Paris and London like using their extensive transit systems. And in Manchester and Rome, roughly two out of three journeys are by car.

-

 Politics5 days ago
Charted: What Southeast Asia Thinks About China & the U.S.
-

 Misc2 weeks ago
Visualizing the Most Common Pets in the U.S.
-

 Culture2 weeks ago
The World’s Top Media Franchises by All-Time Revenue
-

 Best of2 weeks ago
Best Visualizations of April on the Voronoi App
-

 Wealth1 week ago
Charted: Which Country Has the Most Billionaires in 2024?
-

 Markets1 week ago
The Top Private Equity Firms by Country
-

 Markets1 week ago
The Best U.S. Companies to Work for According to LinkedIn
-

 Economy1 week ago
Ranked: The Top 20 Countries in Debt to China