Misc
Sports Streaming Interest in the U.S. by State
Article/Editing:
Sports Streaming Interest in the U.S.
The global streaming revolution is well underway, and sports streaming is no different.
In 2022, 85% of Americans had a streaming account and 58% had more than one. And with old exclusive cable deals winding down, sports streaming interest has grown from both consumers and providers, including sports leagues, streamers, and cable providers.
This graphic from ExpressVPN provides an overview of sports streaming interest in America by using Google Trends data to examine the most searched-for sports.
Sports Streaming Search Trends
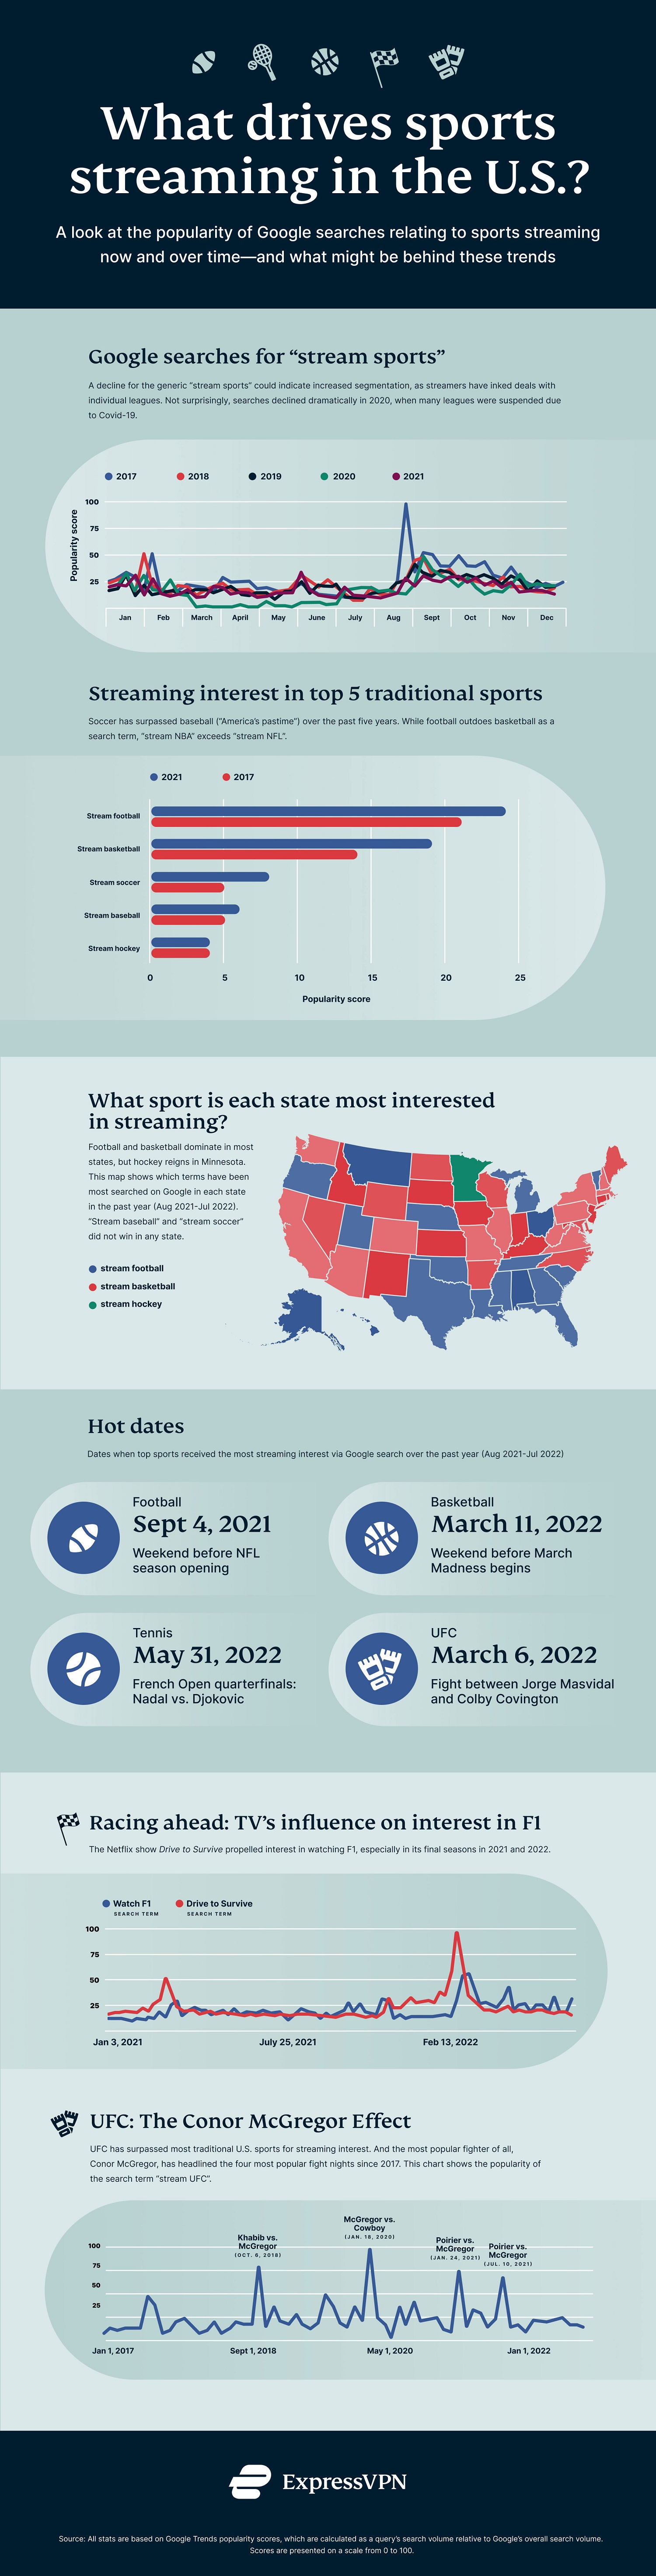
Examining the frequency of streaming sports queries reveals both important sporting events and the effects of COVID-19.
From 2017 to 2021, some of the notable and recurring spikes in sports streaming interest occurred around the following dates:
- Early January to Mid-February, coinciding with the NFL playoff season and the Superbowl.
- Early June, coinciding with the NBA and NHL finals playoffs and the UEFA Champion’s League final.
- Early September, coinciding with the start of the NFL regular season, and cascading into October for the start of the MLB playoffs and NBA and NHL regular seasons.
One major exception? The end of August in 2017 saw the largest spike in searches, likely for the professional boxing match between Floyd Mayweather Jr. and Conor McGregor. Illegal streams alone reached nearly 3 million viewers.
And of course, interest in 2020 bottomed out in March during the start of the pandemic, picking back up in July once the first sports leagues restarted.
Sports Streaming Popularity by States and Hot Dates
From 2017 to 2021, soccer, basketball, and football saw notable surges in streaming interest.
With football and baseball long considered as America’s favorite pastimes, the uptick for soccer is especially notable. The sport’s popularity in the U.S. has tripled in the last decade, which may continue to climb as the 2026 World Cup will be hosted in North America.
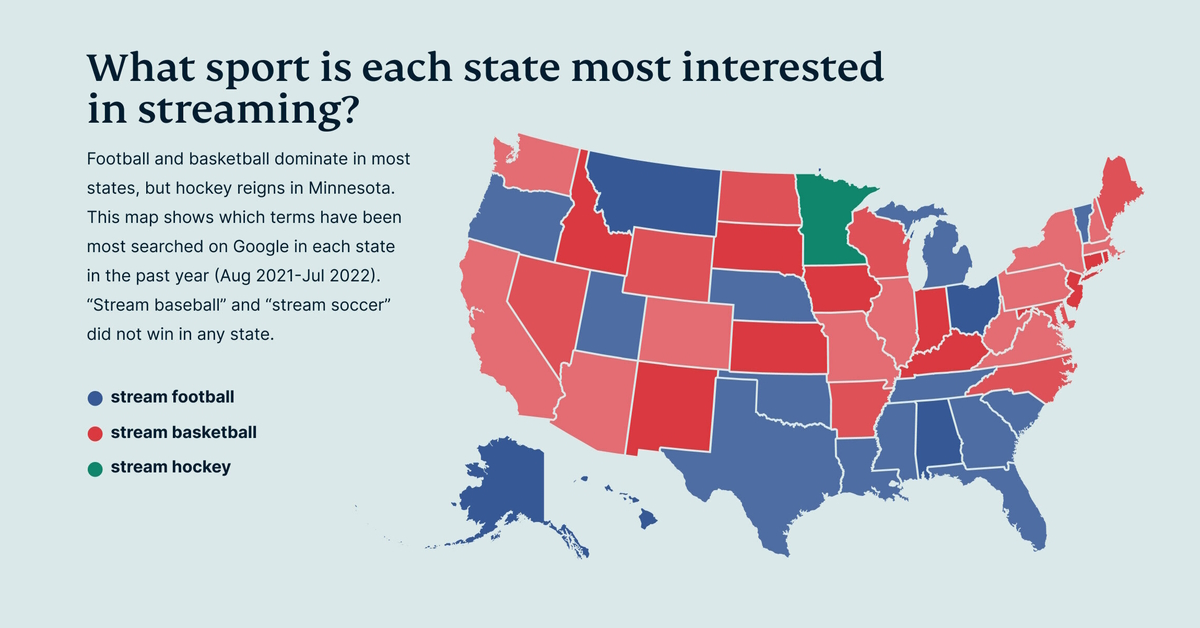
But when looking at the most popular sport in all 50 states by streaming interest, football and basketball came out on top.
| State | Top Searched Sport |
|---|---|
| Alabama | 🏈 Football |
| Alaska | 🏈 Football |
| Arizona | 🏀 Basketball |
| Arkansas | 🏀 Basketball |
| California | 🏀 Basketball |
| Colorado | 🏀 Basketball |
| Connecticut | 🏀 Basketball |
| DC | 🏀 Basketball |
| Delaware | 🏀 Basketball |
| Florida | 🏈 Football |
| Georgia | 🏈 Football |
| Hawaii | 🏈 Football |
| Idaho | 🏀 Basketball |
| Illinois | 🏀 Basketball |
| Indiana | 🏀 Basketball |
| Iowa | 🏀 Basketball |
| Kansas | 🏀 Basketball |
| Kentucky | 🏀 Basketball |
| Louisiana | 🏈 Football |
| Maine | 🏀 Basketball |
| Maryland | 🏀 Basketball |
| Massachusetts | 🏈 Football |
| Michigan | 🏈 Football |
| Minnesota | 🏒 Hockey |
| Mississippi | 🏈 Football |
| Missouri | 🏀 Basketball |
| Montana | 🏈 Football |
| Nebraska | 🏈 Football |
| Nevada | 🏀 Basketball |
| New Jersey | 🏀 Basketball |
| New Mexico | 🏀 Basketball |
| New York | 🏀 Basketball |
| North Carolina | 🏀 Basketball |
| North Dakota | 🏀 Basketball |
| Ohio | 🏈 Football |
| Oklahoma | 🏈 Football |
| Oregon | 🏈 Football |
| Pennsylvania | 🏀 Basketball |
| Rhode Island | 🏀 Basketball |
| South Carolina | 🏈 Football |
| South Dakota | 🏀 Basketball |
| Tennessee | 🏈 Football |
| Texas | 🏈 Football |
| Utah | 🏈 Football |
| Vermont | 🏈 Football |
| Virginia | 🏀 Basketball |
| Washington | 🏀 Basketball |
| West Virginia | 🏀 Basketball |
| Wisconsin | 🏀 Basketball |
| Wyoming | 🏀 Basketball |
By number of states, basketball takes the first spot. 30 states including California and much of the Northeastern U.S. searched for NBA streams above other sports, reflecting the rising success of the league.
Football was second, with NFL stream searches leading in 19 states including Texas and Florida. But in terms of overall popularity, searches for NFL streams were still more popular than NBA streams in both 2017 and 2021.
The sole standout was Minnesota, which searched for NHL streams above all other sports.
TV’s Influence on Sports
Another factor to consider in sports streaming interest is the influential effect of other popular content.
For example, search interest for Formula 1 streams spiked alongside the introduction of the Netflix documentary on the sport, Drive to Survive. Likewise, the Netflix series The Queen’s Gambit led to record-breaking interest in chess.
And as sports executives know all too well, having overly entertaining or charismatic individuals can also spark attention. Muhammad Ali had an oversize impact on boxing. Tiger Woods causes ratings and attendance for golf events to skyrocket.
What events, or people, will be the next to drive sports streaming interest in the U.S.? And which sport will benefit?

This article was published as a part of Visual Capitalist's Creator Program, which features data-driven visuals from some of our favorite Creators around the world.


VC+
VC+: Get Our Key Takeaways From the IMF’s World Economic Outlook
A sneak preview of the exclusive VC+ Special Dispatch—your shortcut to understanding IMF’s World Economic Outlook report.

Have you read IMF’s latest World Economic Outlook yet? At a daunting 202 pages, we don’t blame you if it’s still on your to-do list.
But don’t worry, you don’t need to read the whole April release, because we’ve already done the hard work for you.
To save you time and effort, the Visual Capitalist team has compiled a visual analysis of everything you need to know from the report—and our VC+ Special Dispatch is available exclusively to VC+ members. All you need to do is log into the VC+ Archive.
If you’re not already subscribed to VC+, make sure you sign up now to access the full analysis of the IMF report, and more (we release similar deep dives every week).
For now, here’s what VC+ members get to see.
Your Shortcut to Understanding IMF’s World Economic Outlook
With long and short-term growth prospects declining for many countries around the world, this Special Dispatch offers a visual analysis of the key figures and takeaways from the IMF’s report including:
- The global decline in economic growth forecasts
- Real GDP growth and inflation forecasts for major nations in 2024
- When interest rate cuts will happen and interest rate forecasts
- How debt-to-GDP ratios have changed since 2000
- And much more!

Get the Full Breakdown in the Next VC+ Special Dispatch
VC+ members can access the full Special Dispatch by logging into the VC+ Archive, where you can also check out previous releases.
Make sure you join VC+ now to see exclusive charts and the full analysis of key takeaways from IMF’s World Economic Outlook.
Don’t miss out. Become a VC+ member today.
What You Get When You Become a VC+ Member
VC+ is Visual Capitalist’s premium subscription. As a member, you’ll get the following:
- Special Dispatches: Deep dive visual briefings on crucial reports and global trends
- Markets This Month: A snappy summary of the state of the markets and what to look out for
- The Trendline: Weekly curation of the best visualizations from across the globe
- Global Forecast Series: Our flagship annual report that covers everything you need to know related to the economy, markets, geopolitics, and the latest tech trends
- VC+ Archive: Hundreds of previously released VC+ briefings and reports that you’ve been missing out on, all in one dedicated hub
You can get all of the above, and more, by joining VC+ today.

-

 Debt1 week ago
How Debt-to-GDP Ratios Have Changed Since 2000
-

 Markets2 weeks ago
Ranked: The World’s Top Flight Routes, by Revenue
-

 Demographics2 weeks ago
Population Projections: The World’s 6 Largest Countries in 2075
-

 Markets2 weeks ago
The Top 10 States by Real GDP Growth in 2023
-

 Demographics2 weeks ago
The Smallest Gender Wage Gaps in OECD Countries
-

 Economy2 weeks ago
Where U.S. Inflation Hit the Hardest in March 2024
-

 Green2 weeks ago
Top Countries By Forest Growth Since 2001
-

 United States2 weeks ago
Ranked: The Largest U.S. Corporations by Number of Employees