Urbanization
Projecting Europe’s Metro Population Growth from 2021‒2100
Article/Editing:
Projecting Europe’s Metro Population Growth from 2021‒2100
European cities have a storied history as global destinations, both for tourism and for immigration.
Despite lengthy histories, they are not immune to the global shifts in population patterns or urbanization. Even though the majority of the EU’s population already lives in urban areas, Europe’s urbanization rate is expected to rise to 84% by 2050.
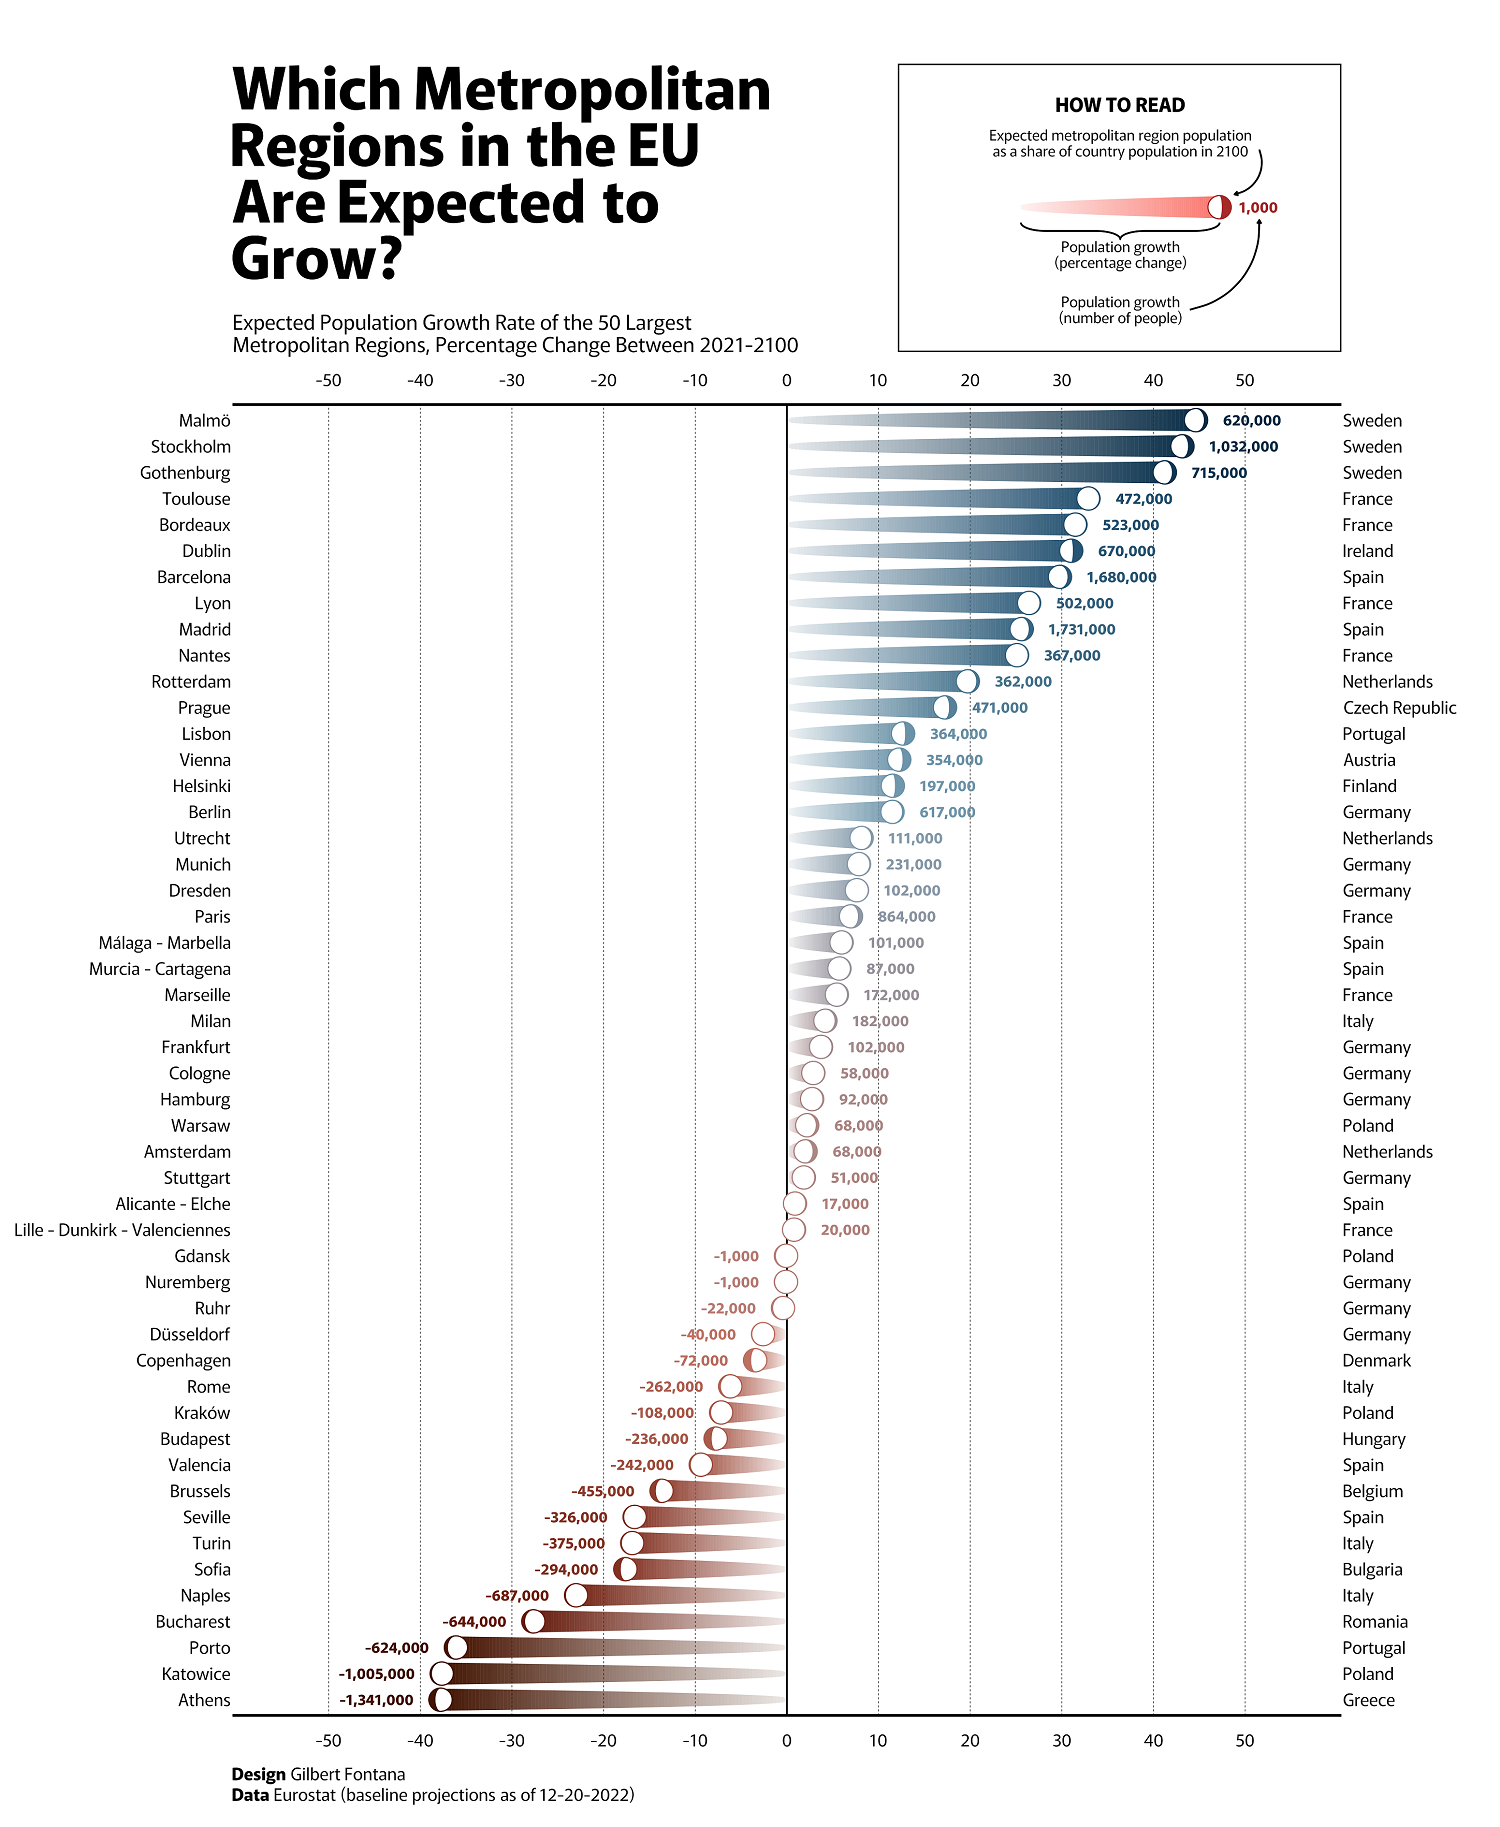
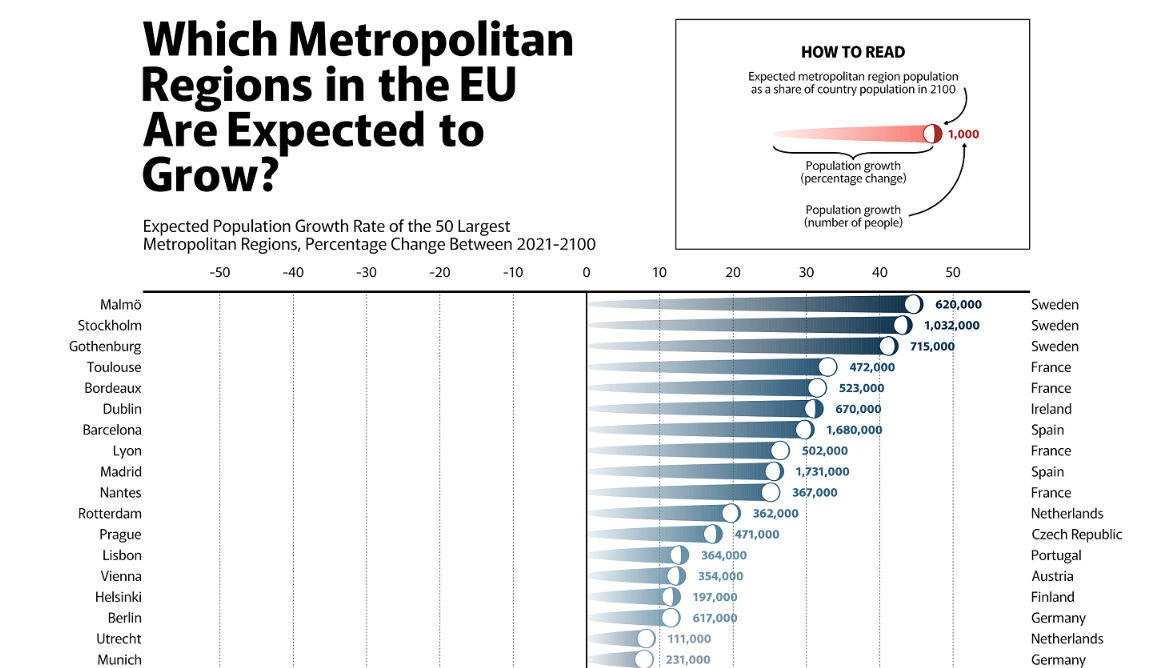
However, not all cities are subject to that same growth. This visual from Gilbert Fontana uses data from Eurostat and breaks down the expected EU population growth rates for the 50 largest metropolitan regions from 2021 to 2100.
Drivers of Growth
It may come as no surprise that economic prosperity is a key driver of population growth.
Countries like Sweden, France, and Ireland are expected to see large swaths of population growth. Sweden’s largest three cities, Stockholm, Gothenburg, and Malmö, are forecasted to experience the largest population growth by 2100 in percentage terms.
| Metro region | Country | Population (2021) | Population (2100) | Growth rate (%) |
|---|---|---|---|---|
| Malmö | Sweden | 1,389,336 | 2,009,510 | 44.6% |
| Stockholm | Sweden | 2,391,990 | 3,424,317 | 43.1% |
| Gothenburg | Sweden | 1,734,443 | 2,449,552 | 41.2% |
| Toulouse | France | 1,434,439 | 1,906,359 | 32.8% |
| Bordeaux | France | 1,661,929 | 2,185,090 | 31.4% |
| Dublin | Ireland | 2,160,781 | 2,831,088 | 31.0% |
| Barcelona | Spain | 5,639,523 | 7,319,537 | 29.7% |
| Lyon | France | 1,899,599 | 2,401,553 | 26.4% |
| Madrid | Spain | 6,755,828 | 8,486,429 | 25.6% |
| Nantes | France | 1,461,267 | 1,828,155 | 25.1% |
| Rotterdam | Netherlands | 1,834,417 | 2,196,555 | 19.7% |
| Prague | Czech Republic | 2,733,081 | 3,204,493 | 17.2% |
| Lisbon | Portugal | 2,869,033 | 3,232,623 | 12.6% |
| Vienna | Austria | 2,890,577 | 3,244,857 | 12.2% |
| Helsinki | Finland | 1,702,678 | 1,899,420 | 11.5% |
| Berlin | Germany | 5,351,765 | 5,968,365 | 11.5% |
| Utrecht | Netherlands | 1,361,153 | 1,472,055 | 8.1% |
| Munich | Germany | 2,932,668 | 3,163,220 | 7.8% |
| Dresden | Germany | 1,339,330 | 1,441,602 | 7.6% |
| Paris | France | 12,348,605 | 13,212,212 | 6.9% |
| Málaga - Marbella | Spain | 1,696,463 | 1,797,664 | 5.9% |
| Murcia - Cartagena | Spain | 1,513,076 | 1,599,781 | 5.7% |
| Marseille | France | 3,146,578 | 3,318,086 | 5.4% |
| Milan | Italy | 4,339,269 | 4,521,518 | 4.1% |
| Frankfurt | Germany | 2,735,932 | 2,837,843 | 3.7% |
| Cologne | Germany | 2,000,289 | 2,057,925 | 2.8% |
| Hamburg | Germany | 3,353,084 | 3,445,284 | 2.7% |
| Warsaw | Poland | 3,095,025 | 3,163,505 | 2.2% |
| Amsterdam | Netherlands | 3,316,712 | 3,384,305 | 2.0% |
| Stuttgart | Germany | 2,787,858 | 2,839,242 | 1.8% |
| Alicante - Elche | Spain | 1,895,192 | 1,911,954 | 0.8% |
| Lille - Dunkirk - Valenciennes | France | 2,607,879 | 2,628,268 | 0.7% |
| Gdansk | Poland | 1,345,623 | 1,344,322 | 0.0% |
| Nürnberg | Germany | 1,352,318 | 1,350,907 | -0.1% |
| Ruhr | Germany | 5,102,484 | 5,080,567 | -0.4% |
| Düsseldorf | Germany | 1,556,846 | 1,516,349 | -2.6% |
| Copenhagen | Denmark | 2,067,916 | 1,996,277 | -3.4% |
| Rome | Italy | 4,231,451 | 3,969,742 | -6.1% |
| Kraków | Poland | 1,510,714 | 1,402,230 | -7.1% |
| Budapest | Hungary | 3,033,638 | 2,797,722 | -7.7% |
| Valencia | Spain | 2,574,888 | 2,332,960 | -9.3% |
| Brussels | Belgium | 3,328,568 | 2,873,299 | -13.6% |
| Seville | Spain | 1,960,919 | 1,635,001 | -16.6% |
| Torino | Italy | 2,219,206 | 1,844,613 | -16.8% |
| Sofia | Bulgaria | 1,667,314 | 1,373,429 | -17.6% |
| Naples | Italy | 2,986,745 | 2,299,616 | -23.0% |
| Bucharest | Romania | 2,327,057 | 1,683,124 | -27.6% |
| Porto | Portugal | 1,727,774 | 1,103,722 | -36.1% |
| Katowice | Poland | 2,668,790 | 1,663,542 | -37.6% |
| Athens | Greece | 3,547,391 | 2,206,511 | -37.7% |
This forecasted growth underscores the strength of Sweden’s economy and global identity, with a very high GDP-per-capita and consistently ranking highly in economic freedom and prosperity.
Europe’s largest population growth in raw numbers, meanwhile, is expected in Spain. The populations of both Madrid and Barcelona are each forecasted to grow by more than 1.6 million people between 2021 and 2100.
On the flip side, some of the regions with the lowest levels of expected growth face challenging economic environments.
For example, Greece is still suffering from the fallout of its sovereign debt crisis in the 2010s, which significantly harmed economic prospects for everyday people. Even though many working-class people have already left the country, Athens is currently expected to see a further population reduction of 1.3 million people or 38% of its population by the end of the century.

This article was published as a part of Visual Capitalist's Creator Program, which features data-driven visuals from some of our favorite Creators around the world.


population
Vintage Viz: World Cities With 1 Million Residents (1800–1930)
From someone born in the 19th century, in the midst of historic population growth, comes this vintage visualization showing world cities growing ever bigger.

World Cities With At Least 1 Million Residents (1800–1930)
This chart is the latest in our Vintage Viz series, which presents historical visualizations along with the context needed to understand them.
The explosive world population boom in the last 300 years is common knowledge today. Much and more has been written about how and why it happened, why it was unusual, and how the specter of a declining population for the first time in three centuries could impact human society.
However, equally compelling, is how people in the past—those living in the midst of the early waves of this boom—were fascinated by what they were witnessing.
Evidence of this comes from today’s vintage visualization, denoting the increasing number of world cities with at least one million inhabitants through the years.
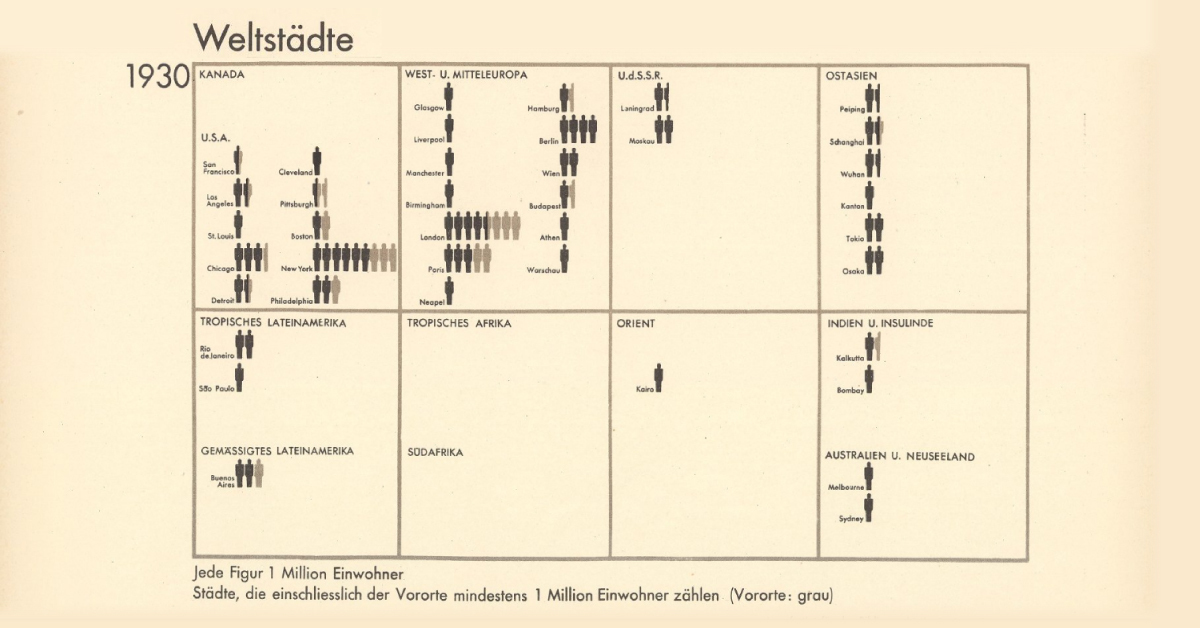
The above pictogram was made by Austrian philosopher and sociologist Otto Neurath (1882–1945), found in his book, Society and Economy, published in 1930.
World Population Doubles Between 1800 and 1930
In 1800, the world population crossed 1 billion for the first time ever.
In the next 130 years, it doubled past 2 billion.
The Second Agricultural Revolution, characterized by massive land and labor productivity, grew agricultural output more than the population and is one of the key drivers of this population growth.
And in the pictogram above, where one silhouette indicates one million inhabitants, this exponential population growth becomes far more vivid.
In 1800, for example, according to the creator’s estimates, only London had at least million residents. A century later, 15 cities now boasted of the same number. Then, three decades hence, 37 cities across the world had one million inhabitants.
| Year | Cities with One Million Residents |
|---|---|
| 1800 | 1 |
| 1900 | 15 |
| 1930 | 37 |
Importantly, the data above is based on the creator’s estimates from a century ago, and does not include Beijing (then referred to as Peking in English) in 1800. Historians now agree that the city had more than a million residents, and was the largest city in the world at the time.
Another phenomenon becoming increasingly apparent is growing urbanization—food surplus frees up large sections of the population from agriculture, driving specialization in other skills and trade, in turn leading to congregations in urban centers.
Other visualizations in the same book covered migration, Indigenous peoples, labor, religion, trade, and natural resources, reflecting the creator’s interest in the social life of individuals and their well-being.
Who Was Otto Neurath and What is His Legacy?
This vintage visualization might seem incredibly simple, simplistic even, considering how we map out population data today. But the creator Otto Neurath, and his wife Marie, were pioneers in the field of visual communication.
One of their notable achievements was the creation of the Vienna Method of pictorial statistics, which aimed to represent statistical information in a visually accessible way—the forerunner to modern-day infographics.
The Neuraths believed in using clear and simple visual language to convey complex information to a broad audience, an approach that laid the foundation for modern information design.
They fled Austria during the rise of the Nazi regime and spent their later years in various countries, including the UK. Otto Neurath’s influence on graphic design, visual communication, and the philosophy of language has endured, and his legacy is still recognized in these fields today.

-

 Mining1 week ago
Gold vs. S&P 500: Which Has Grown More Over Five Years?
-

 Markets2 weeks ago
Ranked: The Most Valuable Housing Markets in America
-

 Money2 weeks ago
Which States Have the Highest Minimum Wage in America?
-

 AI2 weeks ago
Ranked: Semiconductor Companies by Industry Revenue Share
-

 Markets2 weeks ago
Ranked: The World’s Top Flight Routes, by Revenue
-

 Countries2 weeks ago
Population Projections: The World’s 6 Largest Countries in 2075
-

 Markets2 weeks ago
The Top 10 States by Real GDP Growth in 2023
-

 Demographics2 weeks ago
The Smallest Gender Wage Gaps in OECD Countries