Brands
The Most Searched Consumer Brands in 2022
Article/Editing:
View the full-size version of this infographic.
The Most Searched Consumer Brands in 2022
View the high resolution of this infographic by clicking here.
In today’s fast-paced world, a strong brand is a powerful asset that helps a business stand out in a sea of competition.
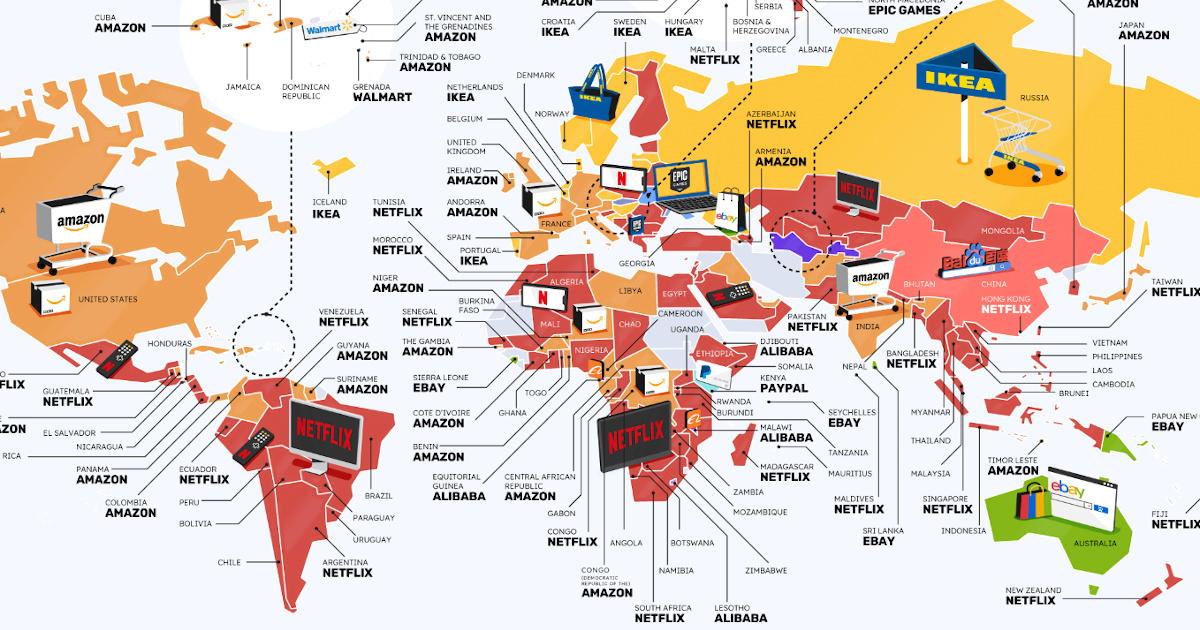
What are some of the most popular brands around the world? One way to gauge this is by looking at Google searches to see what consumers are searching for online (and therefore, what brands they’re paying the most attention to).
This graphic by BusinessFinancing.co.uk uses data from Google Keyword Planner to show the world’s most searched consumer brands in the twelve months leading up to March 2022.
Methodology
To source this wide of a dataset, the team at BusinessFinancing.co.uk first compiled a list of well-known brands, using a number of reputable sources including Forbes, the Financial Times, BrandDirectory, and more.
From there, the team created a shortlist of popular consumer brands. This year, they focused on businesses that sell products and services, so some of the big tech companies like Google and Meta were excluded from the 2022 ranking.
Next, the team used Google Ads API to extract search volume data for the shortlisted brands. They looked at a couple of things:
- The monthly average of searches over the last 12 months for the brand name alone (e.g. “Nike”)
- Brand name with the corresponding sector added to the keyword (“Nike clothing”), which helped offset the skew in search volume for generic terms like “Apple” or “Amazon”
They did this for every country in the world with data available. Here’s what they found.
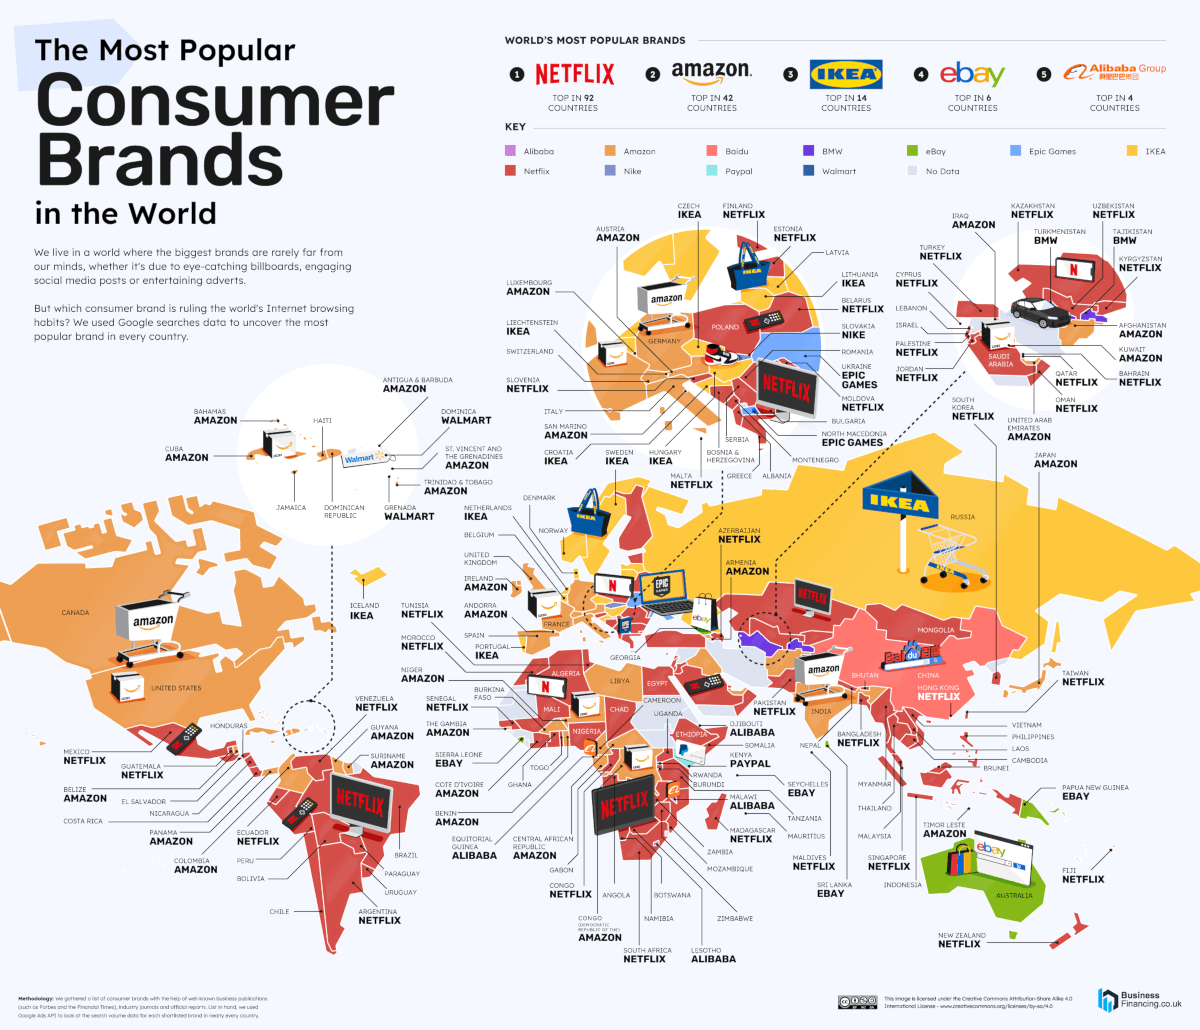
The Top 5 Most Searched Brands
While Netflix is the most frequently searched brand in the highest number of countries (92), Amazon takes the top spot when it comes to total search volume.
Here’s a look at the top five most search brands by average global monthly searches:
| Brand | Average global monthly searches (March 2022) | # Countries Most-Searched In |
|---|---|---|
| Amazon | 335,400,000 | 42 |
| Netflix | 140,200,000 | 92 |
| eBay | 80,600,000 | 6 |
| Walmart | 76,100,000 | 2 |
| IKEA | 55,300,000 | 14 |
But a brand’s search popularity doesn’t necessarily reflect that the business is thriving. For instance, in April 2022, Netflix announced it had lost around 200,000 subscribers throughout Q1.
The week of the announcement, Netflix’s stock price dipped below $200—the lowest it had been since 2017.
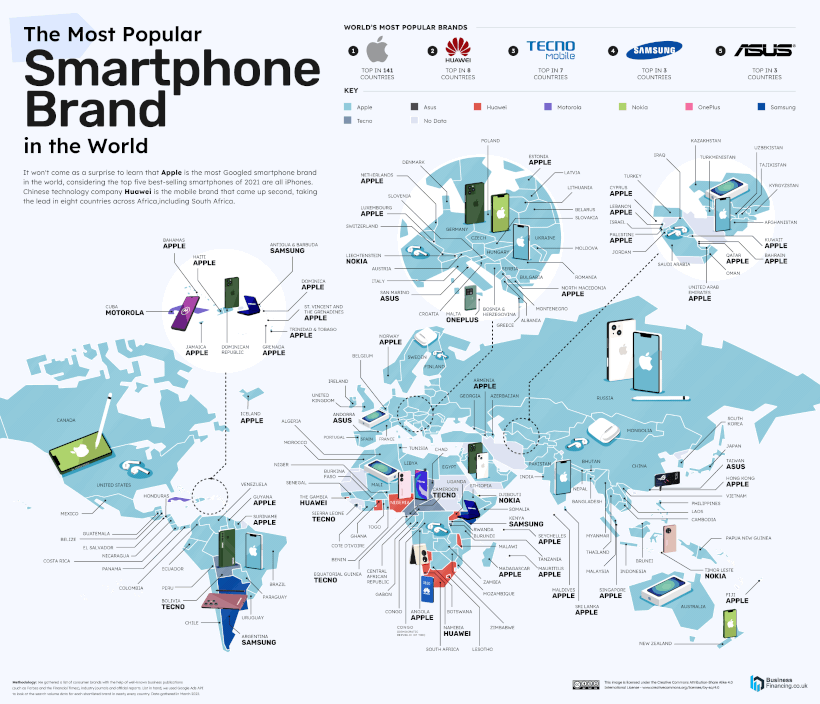
Smartphones
Apple and its iPhone take the top spot when it comes to smartphone searches, which may be unsurprisingly considering the top five best-selling smartphones in 2021 were all iPhones.
View the high resolution of this infographic by clicking here.
It’s worth noting that the top five best-selling smartphones only capture a fraction of the overall smartphone market, and while iPhones are undeniably popular, they only make up 16.7% of worldwide smartphone sales.
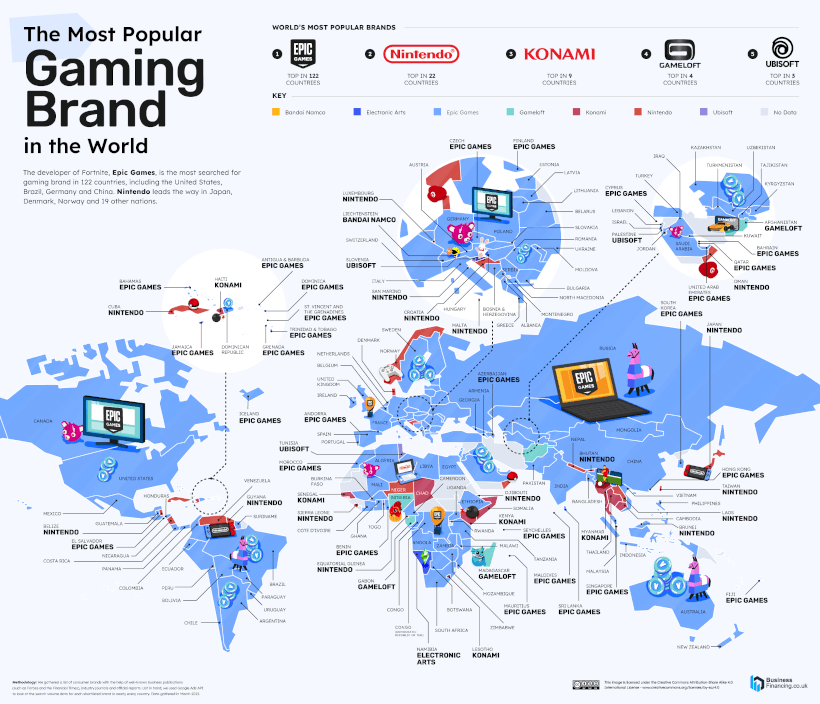
Gaming
Epic Games, the creator and platform of Fortnite, maintains its status as the most searched-for gaming brand worldwide, with an average of 14.9 million global monthly searches.
View the high resolution of this infographic by clicking here.
No other gaming company came close to Epic Game’s search volume. For instance, Nintendo, which came in second place, only averaged 3.2 million searches a month.
However, Nintendo still managed to generate more than $16 billion in revenue throughout 2021, triple the gross revenue that Epic Games made the same year.
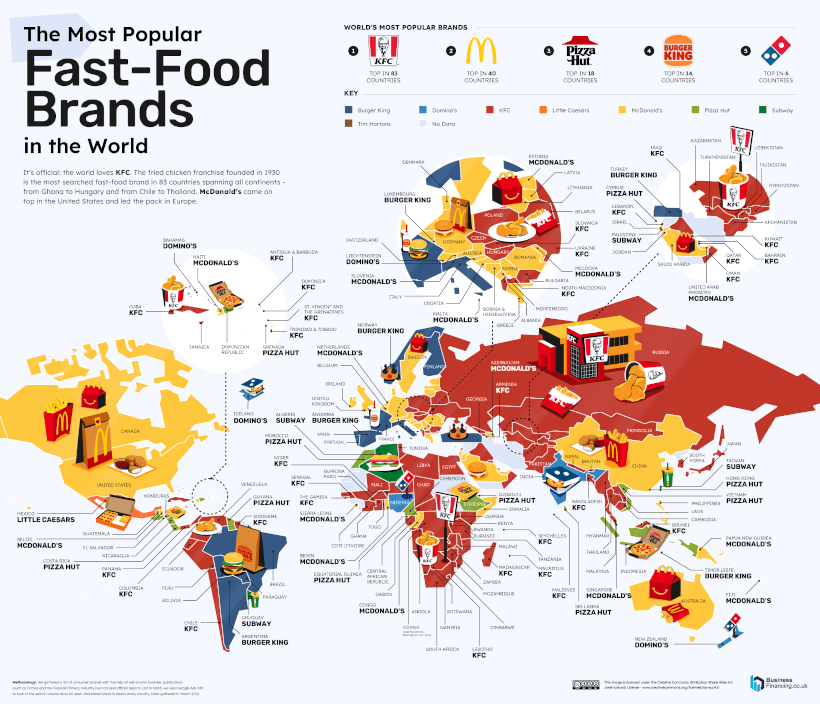
Fast Food
KFC was the most searched fast-food company in more than 83 countries, making it the most popular worldwide.
View the high resolution of this infographic by clicking here.
However, it’s worth noting that, while McDonald’s ranked first in fewer countries, it had a higher global monthly search average than its fried chicken competitor.
In 2021, KFC generated approximately $2.79 billion in global revenue, while McDonald’s brought in $23.2 billion.

This article was published as a part of Visual Capitalist's Creator Program, which features data-driven visuals from some of our favorite Creators around the world.


Technology
How Tech Logos Have Evolved Over Time
From complete overhauls to more subtle tweaks, these tech logos have had quite a journey. Featuring: Google, Apple, and more.


How Tech Logos Have Evolved Over Time
This was originally posted on our Voronoi app. Download the app for free on iOS or Android and discover incredible data-driven charts from a variety of trusted sources.
One would be hard-pressed to find a company that has never changed its logo. Granted, some brands—like Rolex, IBM, and Coca-Cola—tend to just have more minimalistic updates. But other companies undergo an entire identity change, thus necessitating a full overhaul.
In this graphic, we visualized the evolution of prominent tech companies’ logos over time. All of these brands ranked highly in a Q1 2024 YouGov study of America’s most famous tech brands. The logo changes are sourced from 1000logos.net.
How Many Times Has Google Changed Its Logo?
Google and Facebook share a 98% fame rating according to YouGov. But while Facebook’s rise was captured in The Social Network (2010), Google’s history tends to be a little less lionized in popular culture.
For example, Google was initially called “Backrub” because it analyzed “back links” to understand how important a website was. Since its founding, Google has undergone eight logo changes, finally settling on its current one in 2015.
| Company | Number of Logo Changes |
|---|---|
| 8 | |
| HP | 8 |
| Amazon | 6 |
| Microsoft | 6 |
| Samsung | 6 |
| Apple | 5* |
Note: *Includes color changes. Source: 1000Logos.net
Another fun origin story is Microsoft, which started off as Traf-O-Data, a traffic counter reading company that generated reports for traffic engineers. By 1975, the company was renamed. But it wasn’t until 2012 that Microsoft put the iconic Windows logo—still the most popular desktop operating system—alongside its name.
And then there’s Samsung, which started as a grocery trading store in 1938. Its pivot to electronics started in the 1970s with black and white television sets. For 55 years, the company kept some form of stars from its first logo, until 1993, when the iconic encircled blue Samsung logo debuted.
Finally, Apple’s first logo in 1976 featured Isaac Newton reading under a tree—moments before an apple fell on his head. Two years later, the iconic bitten apple logo would be designed at Steve Jobs’ behest, and it would take another two decades for it to go monochrome.

-

 Mining1 week ago
Gold vs. S&P 500: Which Has Grown More Over Five Years?
-

 Markets2 weeks ago
Ranked: The Most Valuable Housing Markets in America
-

 Money2 weeks ago
Which States Have the Highest Minimum Wage in America?
-

 AI2 weeks ago
Ranked: Semiconductor Companies by Industry Revenue Share
-

 Markets2 weeks ago
Ranked: The World’s Top Flight Routes, by Revenue
-

 Countries2 weeks ago
Population Projections: The World’s 6 Largest Countries in 2075
-

 Markets2 weeks ago
The Top 10 States by Real GDP Growth in 2023
-

 Demographics2 weeks ago
The Smallest Gender Wage Gaps in OECD Countries