religion
Mapped: Which Countries Get the Most Paid Vacation Days?
Article/Editing:
Click to view this graphic in a higher-resolution.
Mapped: Which Countries Get the Most Paid Vacation Days?
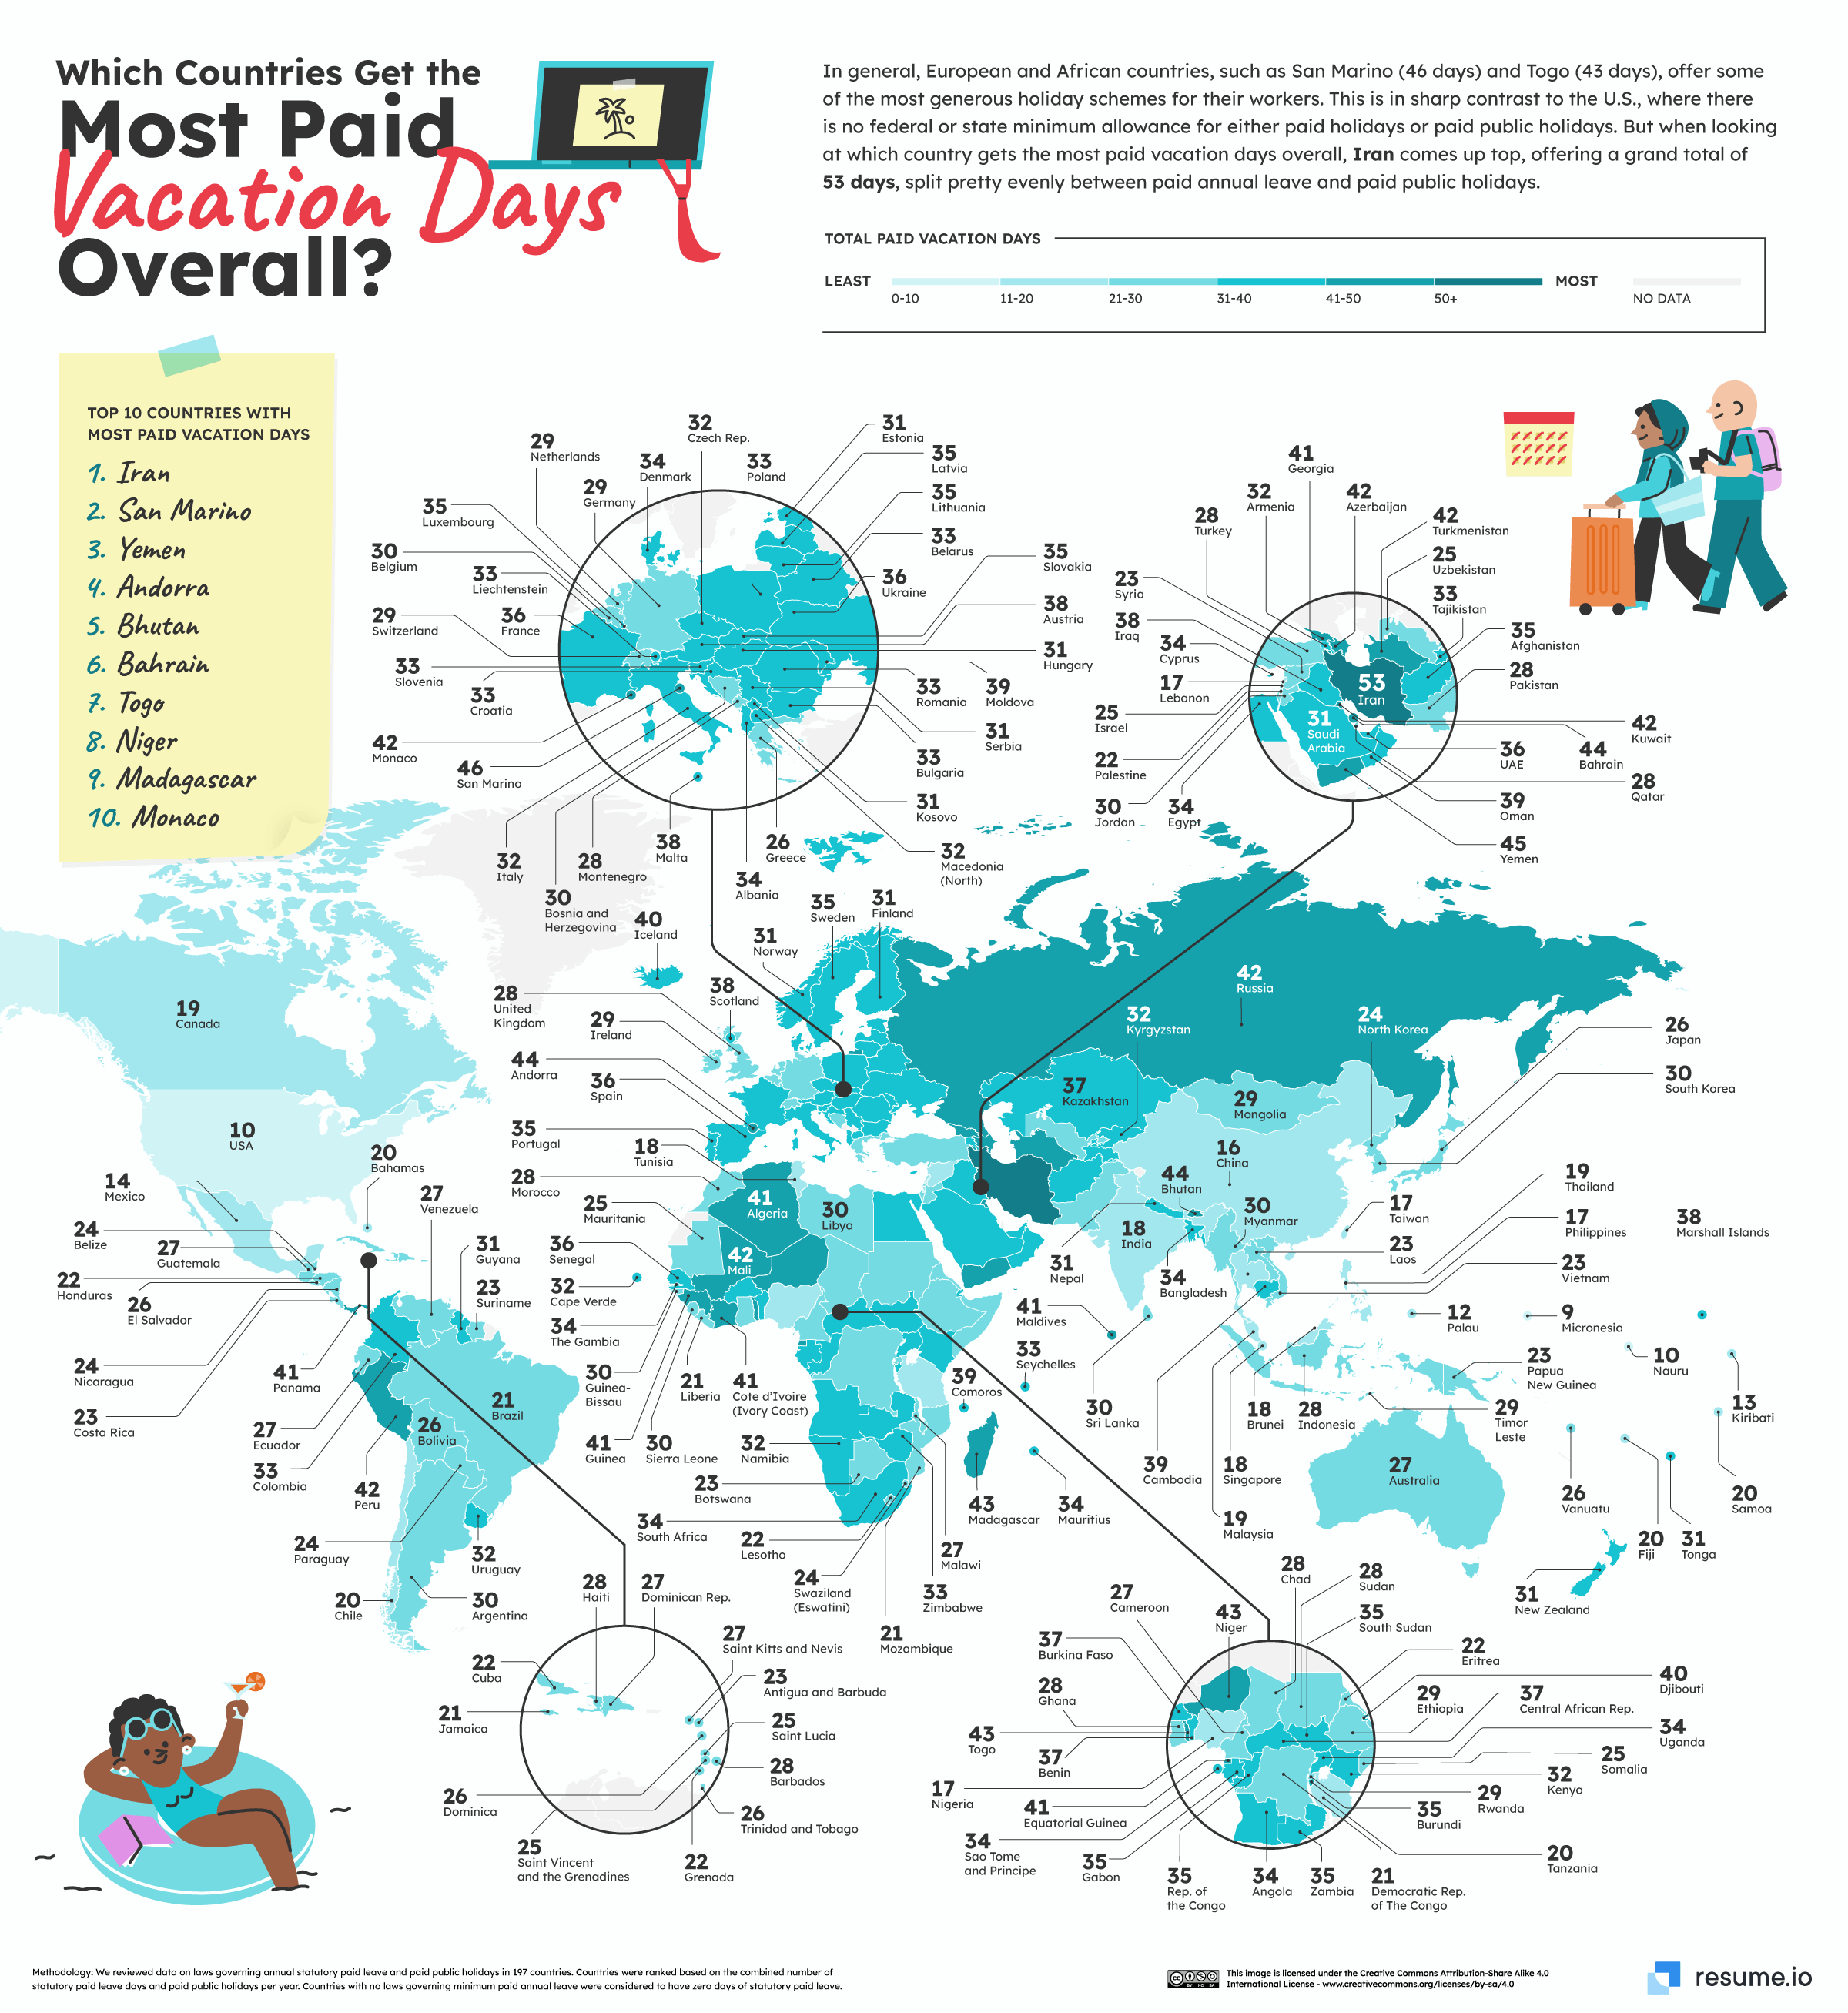
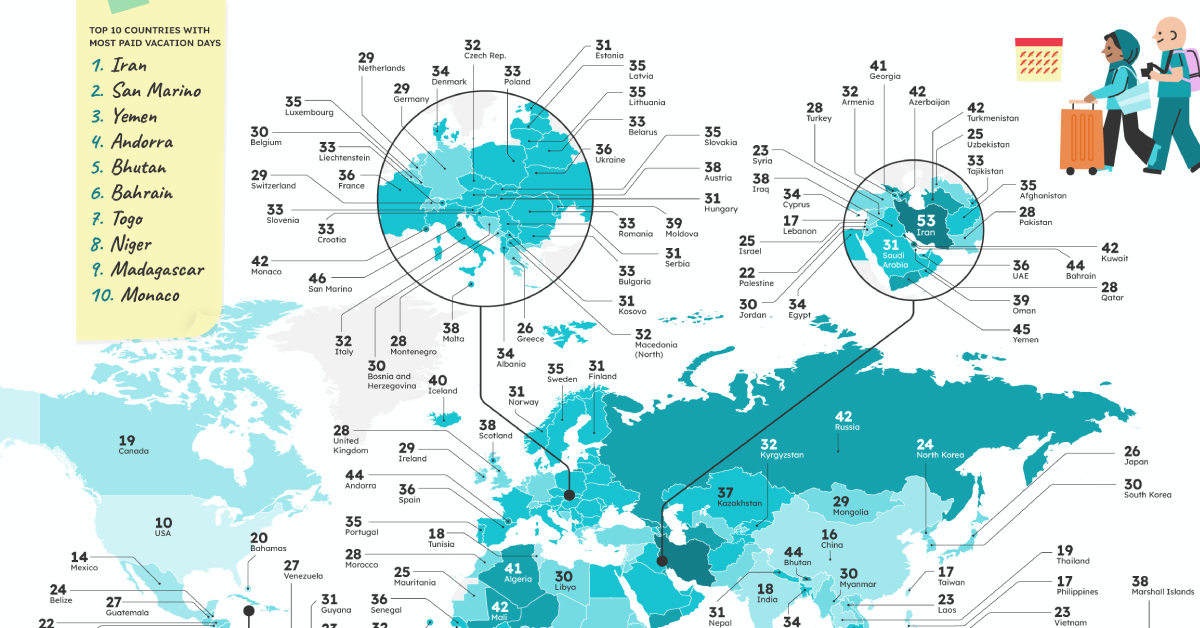
Whether it’s a day off in lieu of a national holiday, a religious festival, or simply a mandated minimum for paid vacation days, there are different rules in each country that set the base threshold of paid time off for workers.
Resume.io analyzed the laws on statutory paid leave and paid public holidays in every country around the world and created these graphics to reveal the minimum amount of vacation days employees are entitled to (at least on paper).
Countries With the Most and Least Paid Vacation
The data in the study focuses in on two types of paid leave: public holidays and paid vacation days. Combine them together and you have the total amount of paid leave.
Here’s how the numbers break down on both ends of the spectrum:
| Rank | Countries With Most Paid Vacation | Total Vacation Days | Countries With Least Paid Vacation | Total Vacation Days |
|---|---|---|---|---|
| 1 | Iran | 53 | Micronesia | 9 |
| 2 | San Marino | 46 | Nauru | 10 |
| 3 | Yemen | 45 | United States | 10 |
| 4 | Andorra | 44 | Palau | 12 |
| 5 | Bhutan | 44 | Kiribati | 13 |
| 6 | Bahrain | 44 | Mexico | 14 |
| 7 | Togo | 43 | China | 16 |
| 8 | Niger | 43 | Lebanon | 17 |
| 9 | Madagascar | 43 | Philippines | 17 |
| 10 | Monaco | 42 | Nigeria | 17 |
| 11 | Kuwait | 42 | Taiwan | 17 |
| 12 | Turkmenistan | 42 | Brunei | 18 |
| 13 | Azerbaijan | 42 | Singapore | 18 |
| 14 | Mali | 42 | Tunisia | 18 |
| 15 | Peru | 42 | India | 18 |
| 16 | Russia | 42 | Malaysia | 19 |
| 17 | Maldives | 41 | Canada | 19 |
| 18 | Equatorial Guinea | 41 | Thailand | 19 |
| 19 | Georgia | 41 | Samoa | 20 |
| 20 | Panama | 41 | Bahamas | 20 |
Some African, European, and Central Asian countries, including Togo (43), San Marino (46) and Yemen (45), have been extremely generous with doling out vacation days.
At the very top is Iran with a total of 53 vacation days, split almost equally between public holidays and paid time off.
Meanwhile, others including the Oceanic countries of Micronesia (9) and Nauru (10) rank at the bottom of the list. The U.S. is tied with Nauru in second-last place, with employees mandated a minimum of only 10 vacation days a year.
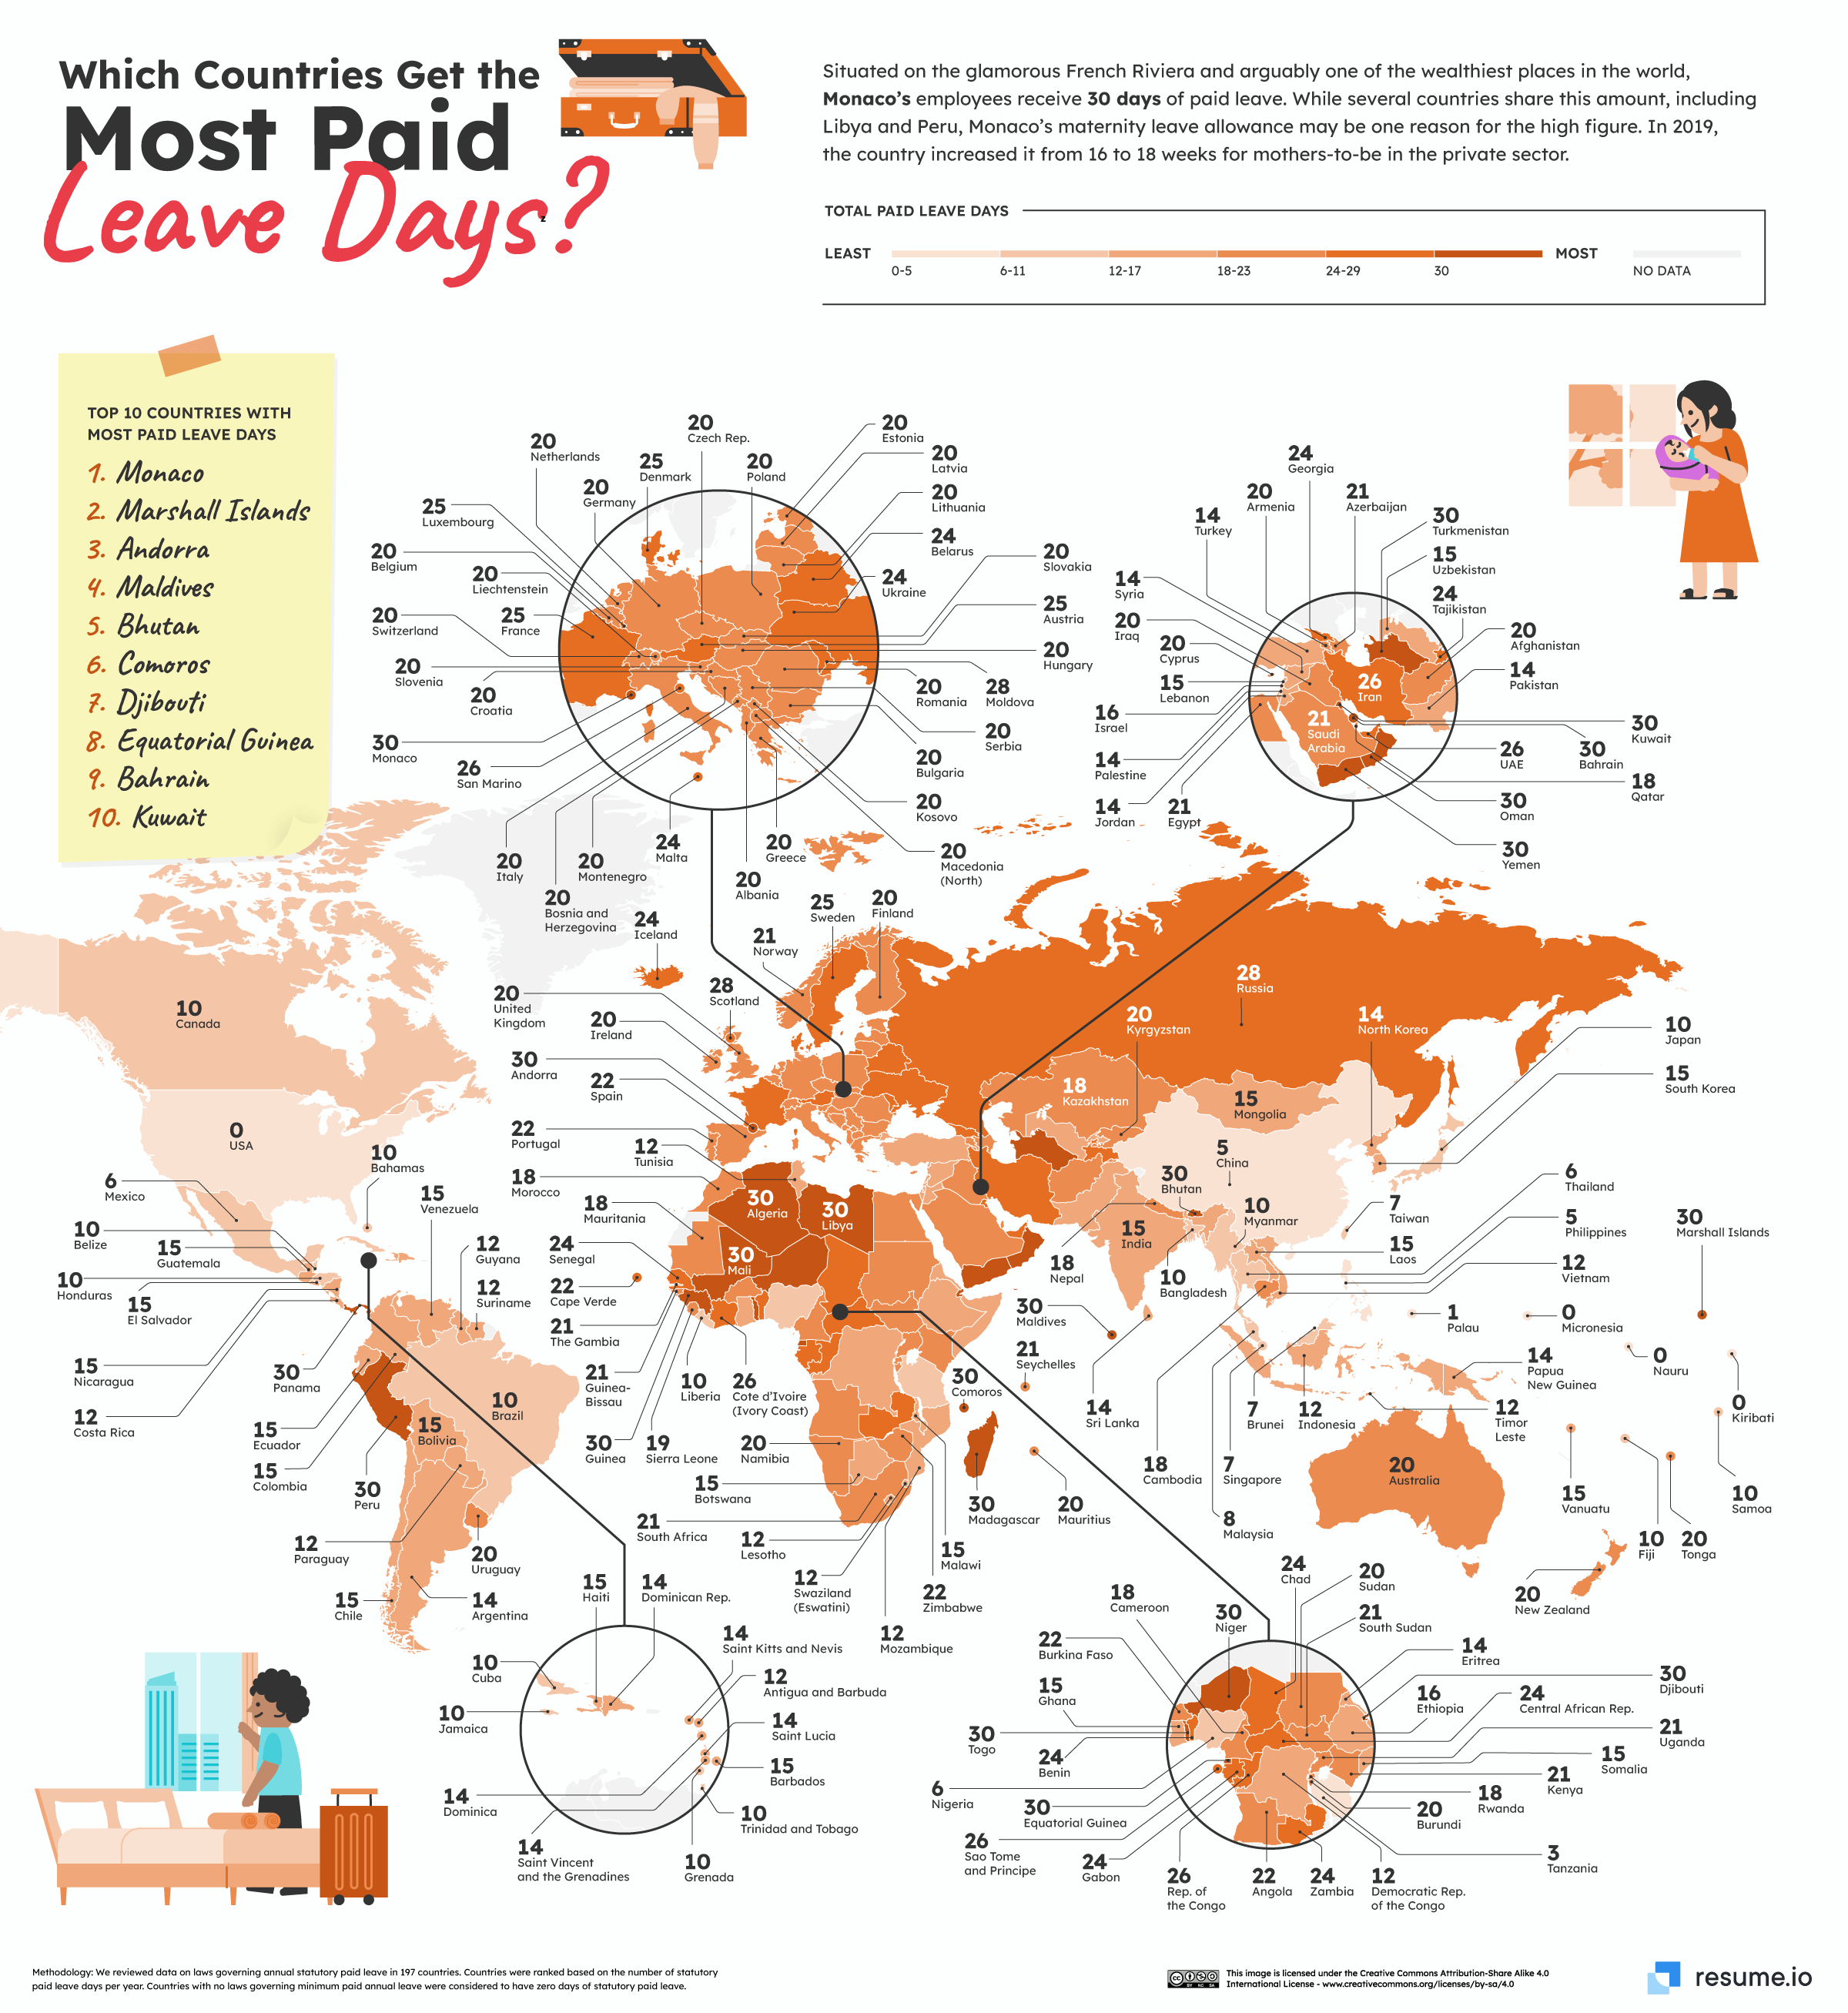
Which Countries Have the Most Paid Leave Days?
View the full-size infographic
If you’re working full-time and devoting 40 hours per week to your workplace, many nations believe you deserve time off.
In most countries, laws to provide statutory leave to employees are in place. 22 countries have a generous 30-day leave policy, with 10 located in Africa.
However, the amount of paid leave around the world often relies on the employee’s tenure. And not all countries have the same minimums, as the U.S., Nauru, Micronesia, and Kiribati, have zero mandated paid leave days.
It’s important to note that this does not mean that all employees in these countries have zero paid leave. Instead it means that it’s up to the hiring employer, with some companies using generous paid leave to entice skilled employees while others offer none.
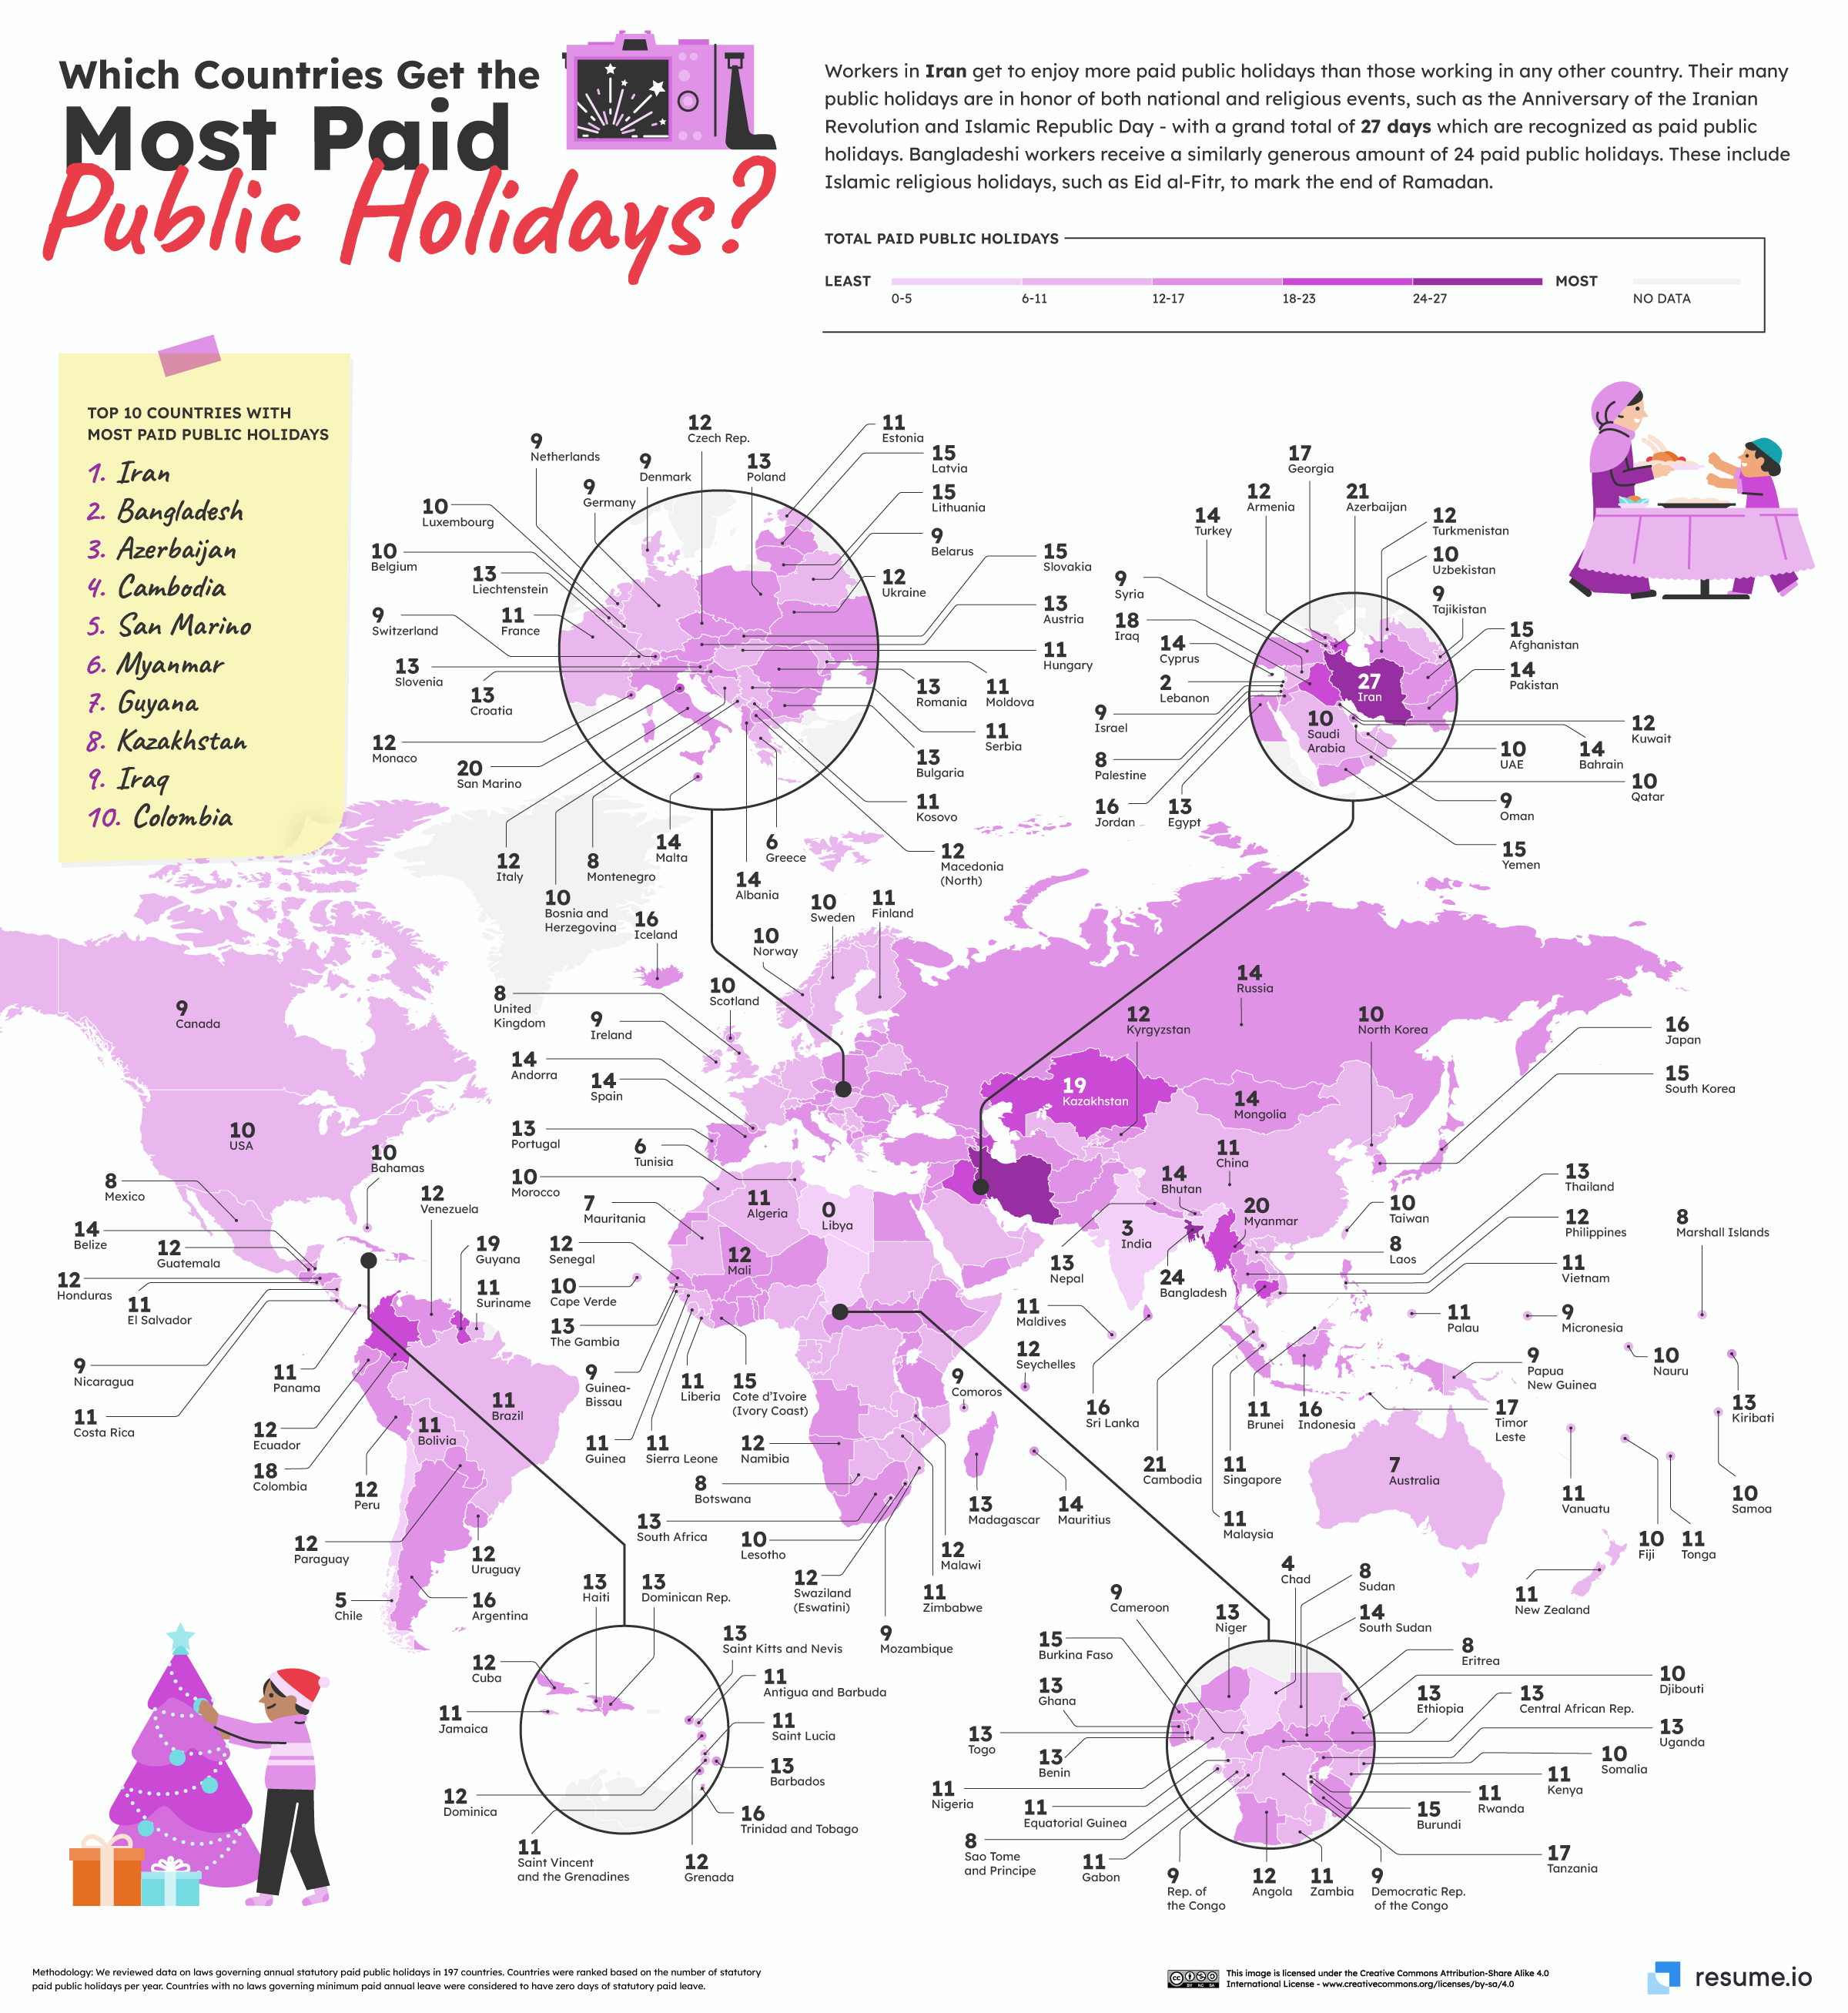
Which Countries Have the Most Public Holidays?
View the full-size infographic
Countries around the world celebrate public holidays for numerous different occasions. They honor significant national, cultural, and religious events.
Again, the number of these days can vary worldwide. Iran offers the highest number of paid public holidays in the world with a total 27 days per year including the Islamic Republic Day. It is followed by Bangladesh (24), Azerbaijan (21), and Cambodia (21).
On the other extreme, Libya has no paid public holidays, while Lebanon has only two paid public holidays per year.
And not every celebration is a holiday. For example, despite having a plethora of festivals and days of national importance, India has only three paid national holidays: Republic Day, Independence Day, and the birthday of Mahatma Gandhi.
However, India is also a good example of countries which also offer state-level holidays. Every state is empowered to add to its list of paid holidays based on their religious, cultural and historical occasions.

This article was published as a part of Visual Capitalist's Creator Program, which features data-driven visuals from some of our favorite Creators around the world.


Culture
The World’s Most Popular Religions
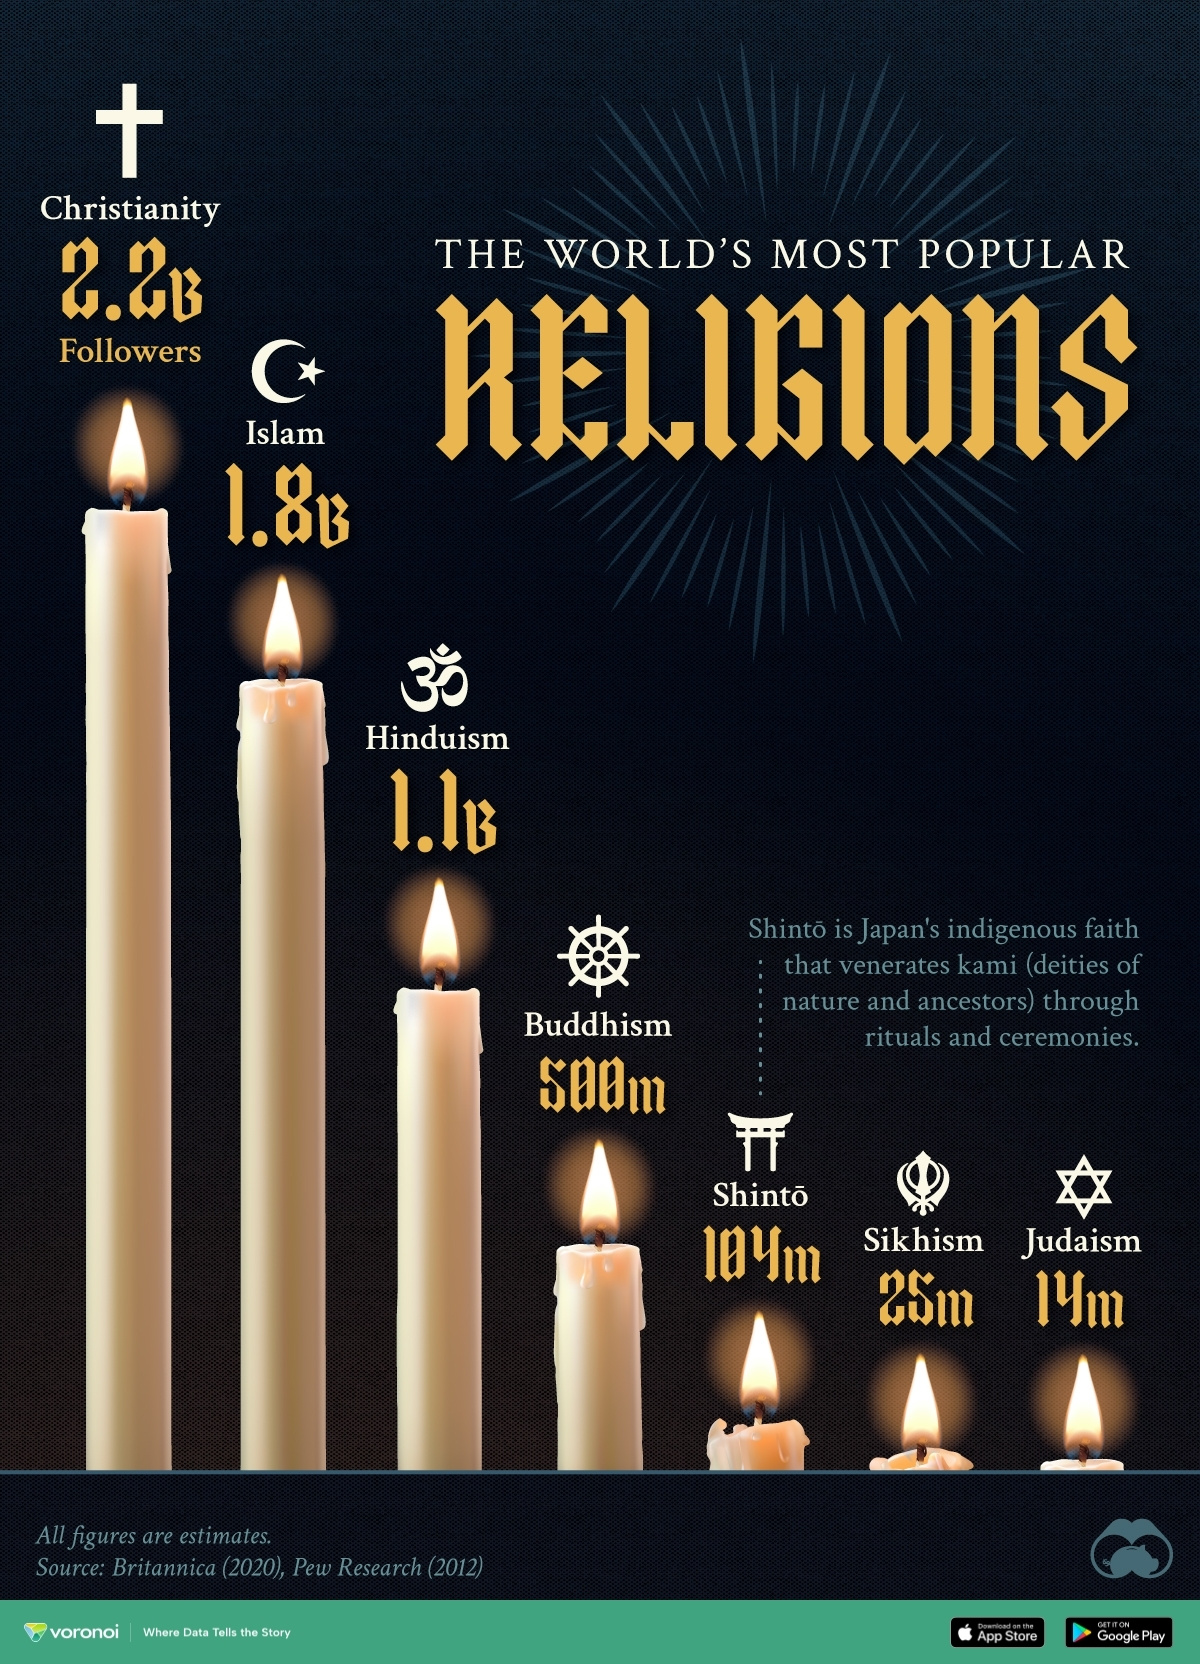
The world’s three biggest religions have a combined 5 billion followers. We rank the most popular religions, based on recent estimates.
The World’s Most Popular Religions
This was originally posted on our Voronoi app. Download the app for free on iOS or Android and discover incredible data-driven charts from a variety of trusted sources.
Religion has played a pivotal role in shaping the beliefs, values, and cultures of societies around the world.
While estimating the exact number of followers for each faith poses a considerable challenge, figures from reputable sources like Britannica and Pew Research provide valuable insights into the global religious landscape.
The Religions With the Most Followers
Below are the seven most popular religions, based on Britannica’s analysis and estimates:
| Rank | Religion | Estimated number of followers |
|---|---|---|
| 1 | Christianity | 2,200,000,000 |
| 2 | Islam | 1,800,000,000 |
| 3 | Hinduism | 1,100,000,000 |
| 4 | Buddhism | 500,000,000 |
| 5 | Shinto | 104,000,000 |
| 6 | Sikhism | 25,000,000 |
| 7 | Judaism | 14,000,000 |
Note: These estimates provide a broad perspective on the distribution of followers for each religion, recognizing the inherent difficulty in accurately counting global adherents.
There are three major religions with over 1 billion followers: Christianity, Islam, and Hinduism.
Buddhism is also a big player, with 500 million followers worldwide. After this, there’s a significant dropoff, with the next three largest religions (Shintō, Sikhism, and Judaism) adding up to fewer than 150 million followers between them.
It’s also worth mentioning that practically speaking, many of these popular religions have various sects, denominations, branches, or interpretations that they can be further grouped into.
For example, Christianity itself can be further categorized into denominations such as Catholic (50.1%), Protestant (36.7%), Eastern Orthodox (9.4%), Oriental Orthodox (2.5%), and other smaller Christian denominations (1.3%).
What Religions Missed the Cut?
Not captured in the above visual are many smaller organized religions, as well as folk and traditional religions, that are distributed all around the world.
Examples of notable religions that did not make the top seven list include: Taoism, Muism, Cao Dai, Baháʼí Faith, Jainism, Tenrikyo, Wicca, and Zoroastrianism.
Meanwhile, hundreds of millions of people also practice African traditional religions, Chinese folk religions, Native American religions, and Australian aboriginal religions.

-

 Mining1 week ago
Gold vs. S&P 500: Which Has Grown More Over Five Years?
-

 Markets2 weeks ago
Ranked: The Most Valuable Housing Markets in America
-

 Money2 weeks ago
Which States Have the Highest Minimum Wage in America?
-

 AI2 weeks ago
Ranked: Semiconductor Companies by Industry Revenue Share
-

 Markets2 weeks ago
Ranked: The World’s Top Flight Routes, by Revenue
-

 Countries2 weeks ago
Population Projections: The World’s 6 Largest Countries in 2075
-

 Markets2 weeks ago
The Top 10 States by Real GDP Growth in 2023
-

 Demographics2 weeks ago
The Smallest Gender Wage Gaps in OECD Countries