Agriculture
Visualizing the Global Coffee Trade by Country
Article/Editing:
Visualizing the Global Coffee Trade by Country
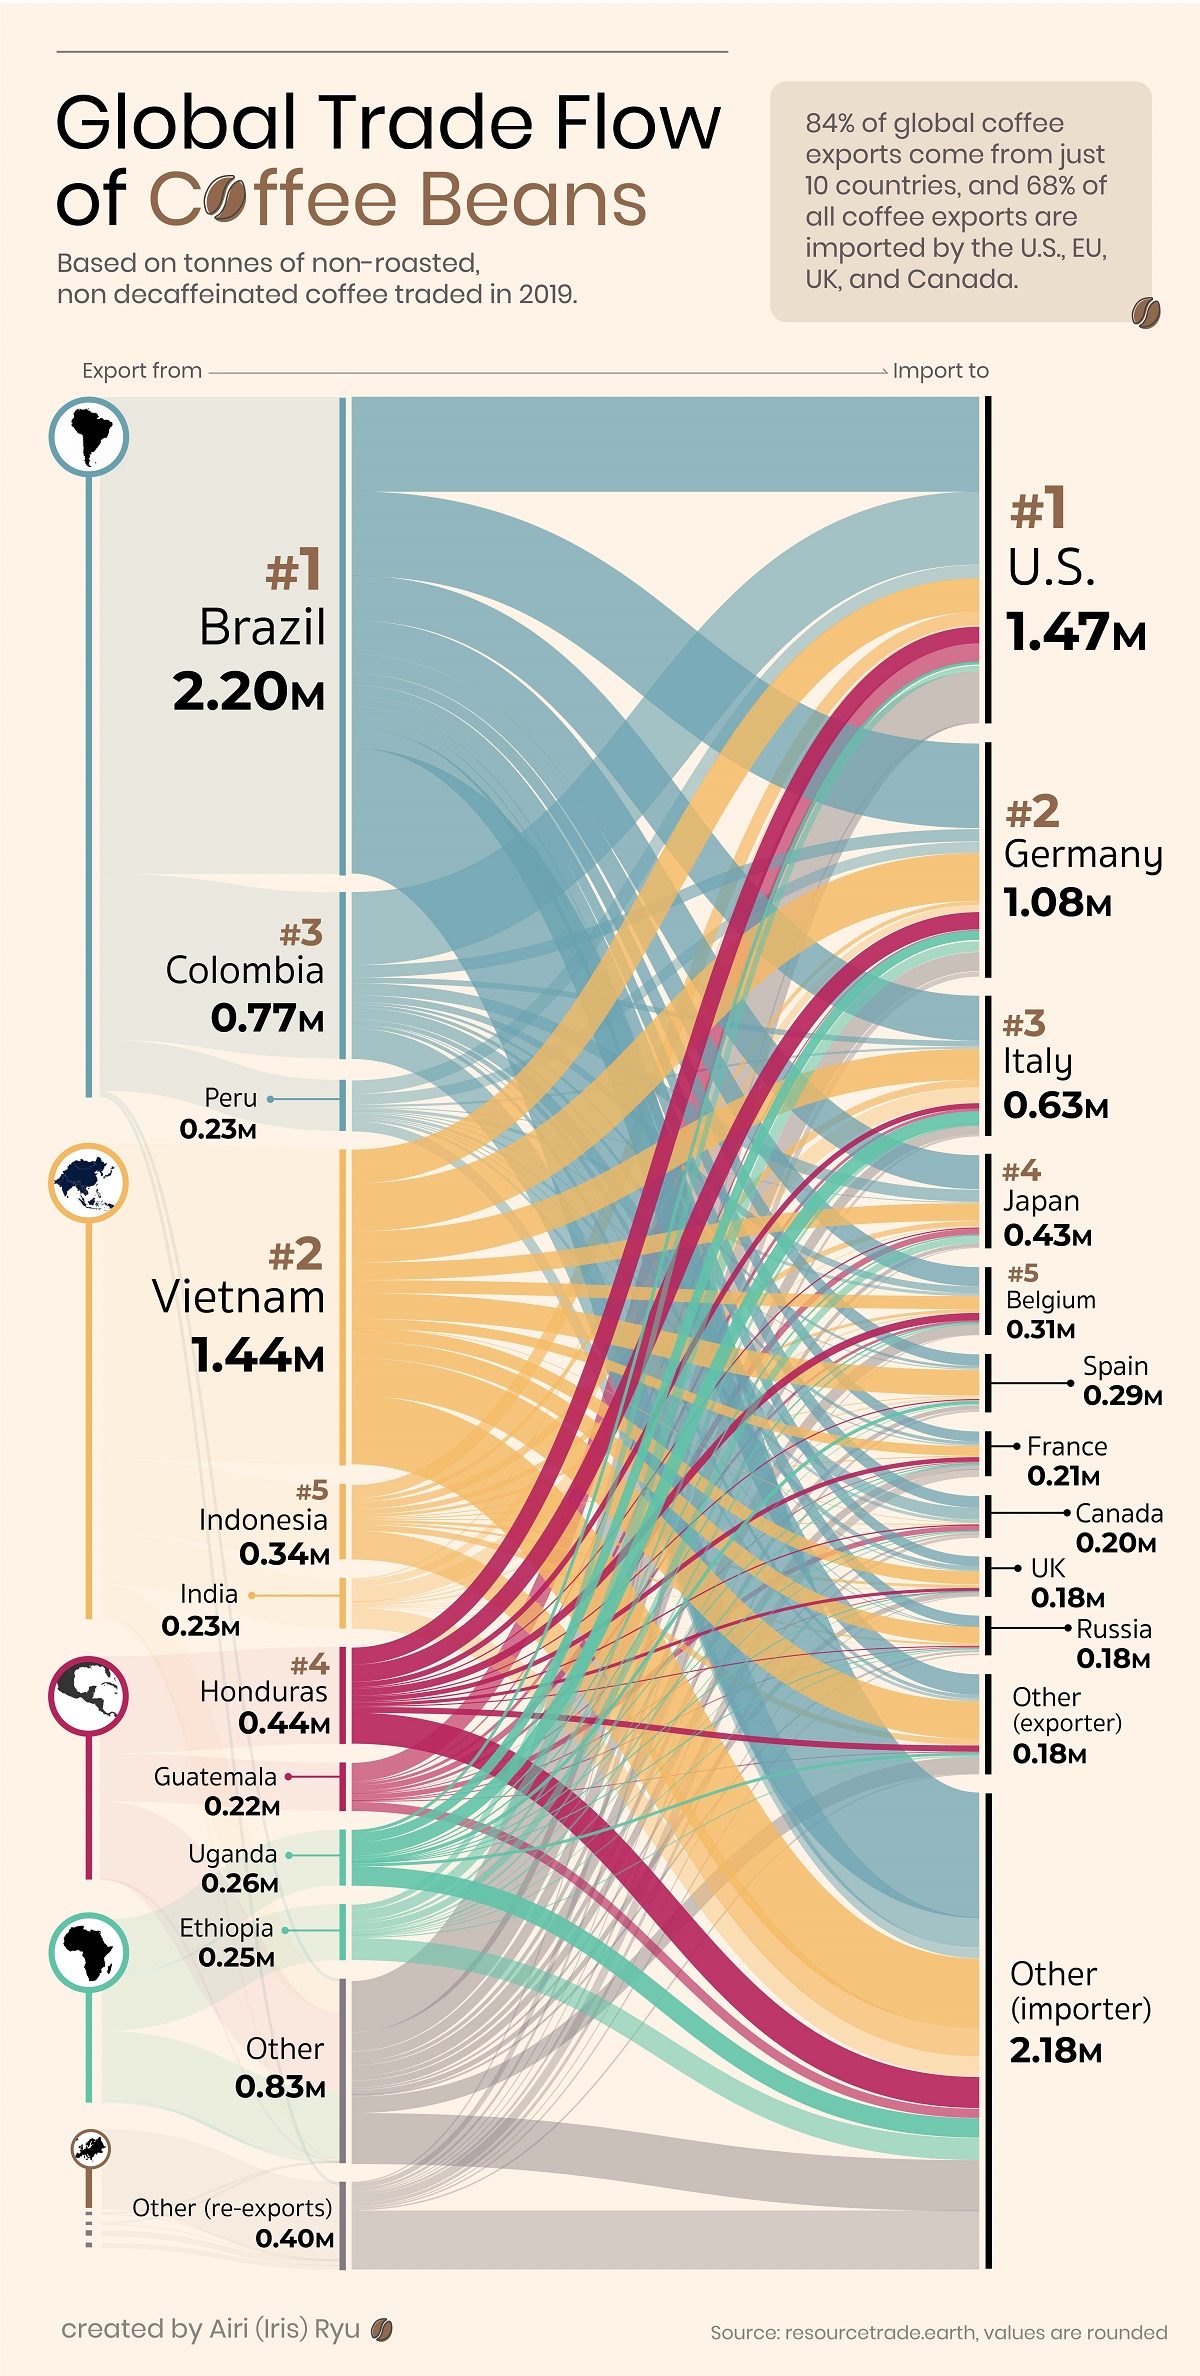
From drip coffees to decadent lattes, every cup of coffee begins its journey from the humble coffee bean. A massive global coffee trade moves these beans from farms in one country to cafes in another.
In this piece, Airi Ryu uses data from Chatham House’s resourcetrade.earth to track the global trade of unroasted and non-decaffeinated coffee beans in 2019, highlighting the world’s top coffee exporters and importers.
The Biggest Exporters in the Global Coffee Trade
Close to 84% of the world’s coffee bean exports come from just 10 countries.
All these countries are found in the “Bean Belt” between the Tropic of Cancer and the Tropic of Capricorn where coffee grows best. These top coffee-producing nations include Brazil, Vietnam, and Colombia.
Here are the top coffee exporting nations in 2019:
| Rank | Country | Coffee Exports (Tonnes) | Share of Total |
|---|---|---|---|
| 1 | 🇧🇷 Brazil | 2.20M | 28.9% |
| 2 | 🇻🇳 Vietnam | 1.44M | 18.9% |
| 3 | 🇨🇴 Colombia | 0.77M | 10.1% |
| 4 | 🇭🇳 Honduras | 0.44M | 5.8% |
| 5 | 🇮🇩 Indonesia | 0.34M | 4.5% |
| 6 | 🇺🇬 Uganda | 0.26M | 3.4% |
| 7 | 🇪🇹 Ethiopia | 0.25M | 3.3% |
| 8 | 🇵🇪 Peru | 0.23M | 3.0% |
| 9 | 🇮🇳 India | 0.23M | 3.0% |
| 10 | 🇬🇹 Guatemala | 0.22M | 2.9% |
| n/a | 🌍 Others | 0.83M | 11.0% |
| n/a | 🌍 Others (re-export) | 0.40M | 5.2% |
The South American nations of Brazil, Colombia, and Peru export nearly 42% of the global coffee beans. Brazil exported over 2.2 million tonnes in 2019 alone, more than a quarter of the global coffee trade.
Across the Pacific, Vietnam and Indonesia together exported 23.4% of the world’s coffee beans in 2019. Other major exporters include the Central American nations of Honduras and Guatemala, which combined for 8.7% of global coffee bean exports, and the African nations Uganda and Ethiopia with 6.7% combined.
Biggest Coffee Bean Importers, By Country
On the other side of the global coffee trade are nations with high demand for coffee dominating import shares. Many of these importing nations also re-export coffee beans to other parts of the world under their own local brands.
Here are the top coffee importing nations in 2019:
| Rank | Country | Coffee Imports (Tonnes) | Share of Total |
|---|---|---|---|
| 1 | 🇺🇸 U.S. | 1.47M | 19.3% |
| 2 | 🇩🇪 Germany | 1.08M | 14.2% |
| 3 | 🇮🇹 Italy | 0.63M | 8.3% |
| 4 | 🇯🇵 Japan | 0.43M | 5.7% |
| 5 | 🇧🇪 Belgium | 0.31M | 4.1% |
| 6 | 🇪🇸 Spain | 0.29M | 3.5% |
| 7 | 🇫🇷 France | 0.21M | 2.7% |
| 8 | 🇨🇦 Canada | 0.20M | 2.6% |
| 9 | 🇬🇧 United Kingdom | 0.18M | 2.4% |
| 10 | 🇷🇺 Russian Federation | 0.18M | 2.4% |
| n/a | 🌍 Others | 2.36M | 34.7% |
The U.S. is the largest importer of coffee beans in the world, bringing in 1.5 million tonnes of unroasted coffee beans in 2019, equivalent to 19.3% of all exports that year. While Brazil and Colombia are its biggest sources of coffee, beans imported from Asia and Central America also thrive thanks to a strong specialty coffee culture.
Europe is also a massive destination for coffee bean exports. Germany led the way with 14.2% of global coffee imports, while Italy accounted for 8.3%.
A brewing coffee culture in Japan has made the country a major player in the global coffee trade. In 2019, Japan was the fourth-largest coffee bean importer in the world and far and away the leading importer in Asia.
As the desire for coffee continues to permeate throughout the world, and as climate change puts a strain on coffee production (and vice versa), the flows of coffee beans are sure to change in the coming decades.

This article was published as a part of Visual Capitalist's Creator Program, which features data-driven visuals from some of our favorite Creators around the world.


Agriculture
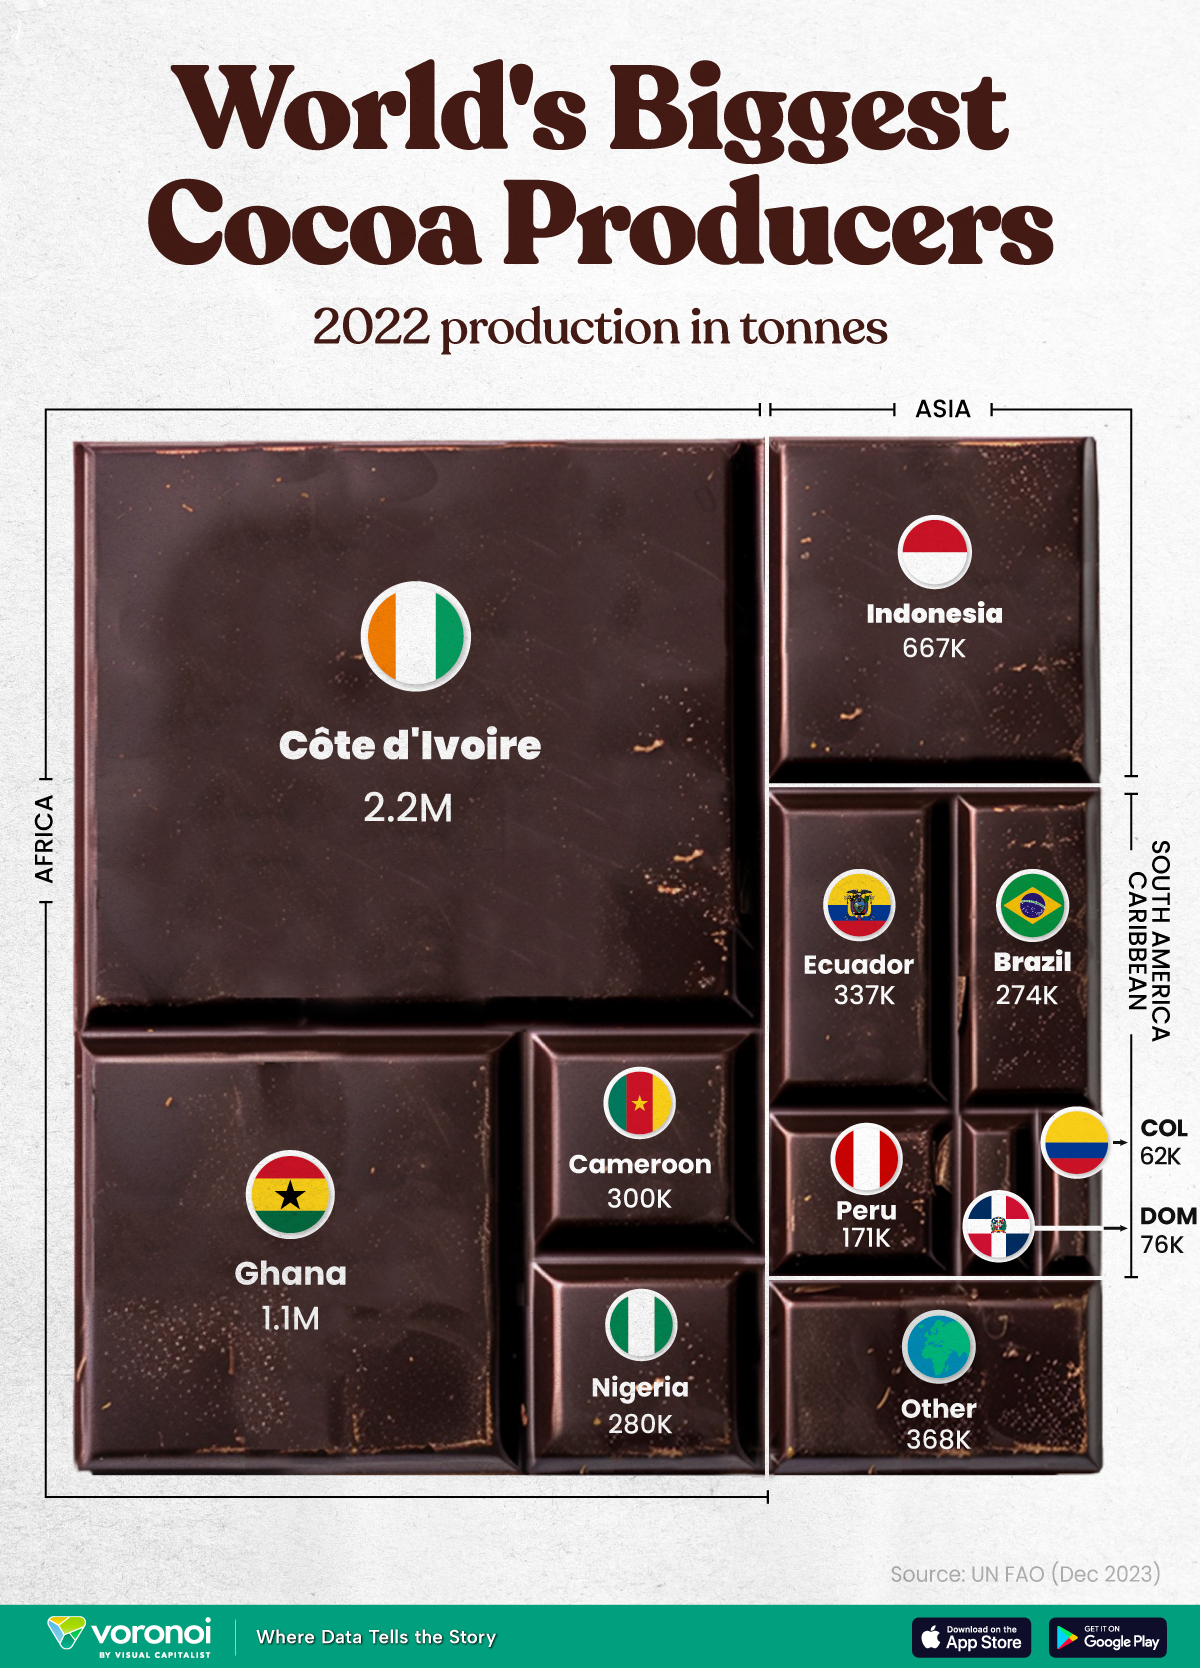
The World’s Top Cocoa Producing Countries
Here are the largest cocoa producing countries globally—from Côte d’Ivoire to Brazil—as cocoa prices hit record highs.
The World’s Top Cocoa Producing Countries
This was originally posted on our Voronoi app. Download the app for free on iOS or Android and discover incredible data-driven charts from a variety of trusted sources.
West Africa is home to the largest cocoa producing countries worldwide, with 3.9 million tonnes of production in 2022.
In fact, there are about one million farmers in Côte d’Ivoire supplying cocoa to key customers such as Nestlé, Mars, and Hershey. But the massive influence of this industry has led to significant forest loss to plant cocoa trees.
This graphic shows the leading producers of cocoa, based on data from the UN FAO.
Global Hotspots for Cocoa Production
Below, we break down the top cocoa producing countries as of 2022:
| Country | 2022 Production, Tonnes |
|---|---|
| 🇨🇮 Côte d'Ivoire | 2.2M |
| 🇬🇭 Ghana | 1.1M |
| 🇮🇩 Indonesia | 667K |
| 🇪🇨 Ecuador | 337K |
| 🇨🇲 Cameroon | 300K |
| 🇳🇬 Nigeria | 280K |
| 🇧🇷 Brazil | 274K |
| 🇵🇪 Peru | 171K |
| 🇩🇴 Dominican Republic | 76K |
| 🌍 Other | 386K |
With 2.2 million tonnes of cocoa in 2022, Côte d’Ivoire is the world’s largest producer, accounting for a third of the global total.
For many reasons, the cocoa trade in Côte d’Ivoire and Western Africa has been controversial. Often, farmers make about 5% of the retail price of a chocolate bar, and earn $1.20 each day. Adding to this, roughly a third of cocoa farms operate on forests that are meant to be protected.
As the third largest producer, Indonesia produced 667,000 tonnes of cocoa with the U.S., Malaysia, and Singapore as major importers. Overall, small-scale farmers produce 95% of cocoa in the country, but face several challenges such as low pay and unwanted impacts from climate change. Alongside aging trees in the country, these setbacks have led productivity to decline.
In South America, major producers include Ecuador and Brazil. In the early 1900s, Ecuador was the world’s largest cocoa producing country, however shifts in the global marketplace and crop disease led its position to fall. Today, the country is most known for its high-grade single-origin chocolate, with farms seen across the Amazon rainforest.
Altogether, global cocoa production reached 6.5 million tonnes, supported by strong demand. On average, the market has grown 3% annually over the last several decades.

-

 Debt1 week ago
How Debt-to-GDP Ratios Have Changed Since 2000
-

 Markets2 weeks ago
Ranked: The World’s Top Flight Routes, by Revenue
-

 Countries2 weeks ago
Population Projections: The World’s 6 Largest Countries in 2075
-

 Markets2 weeks ago
The Top 10 States by Real GDP Growth in 2023
-

 Demographics2 weeks ago
The Smallest Gender Wage Gaps in OECD Countries
-

 United States2 weeks ago
Where U.S. Inflation Hit the Hardest in March 2024
-

 Green2 weeks ago
Top Countries By Forest Growth Since 2001
-

 United States2 weeks ago
Ranked: The Largest U.S. Corporations by Number of Employees