Green
Comparing Lightning-Caused and Human-Caused U.S. Wildfires
Article/Editing:
Comparing Lightning-Caused and Human-Caused U.S. Wildfires
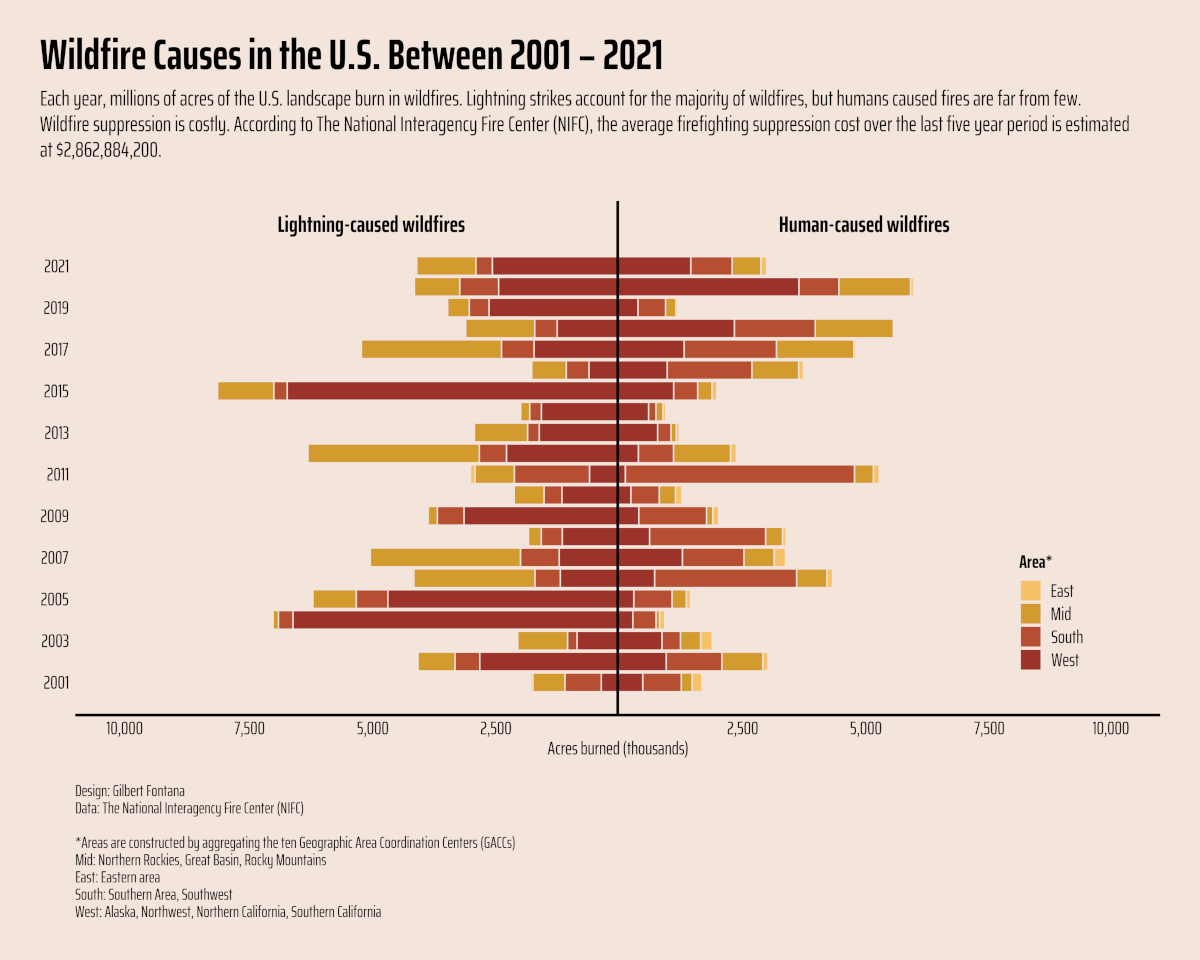
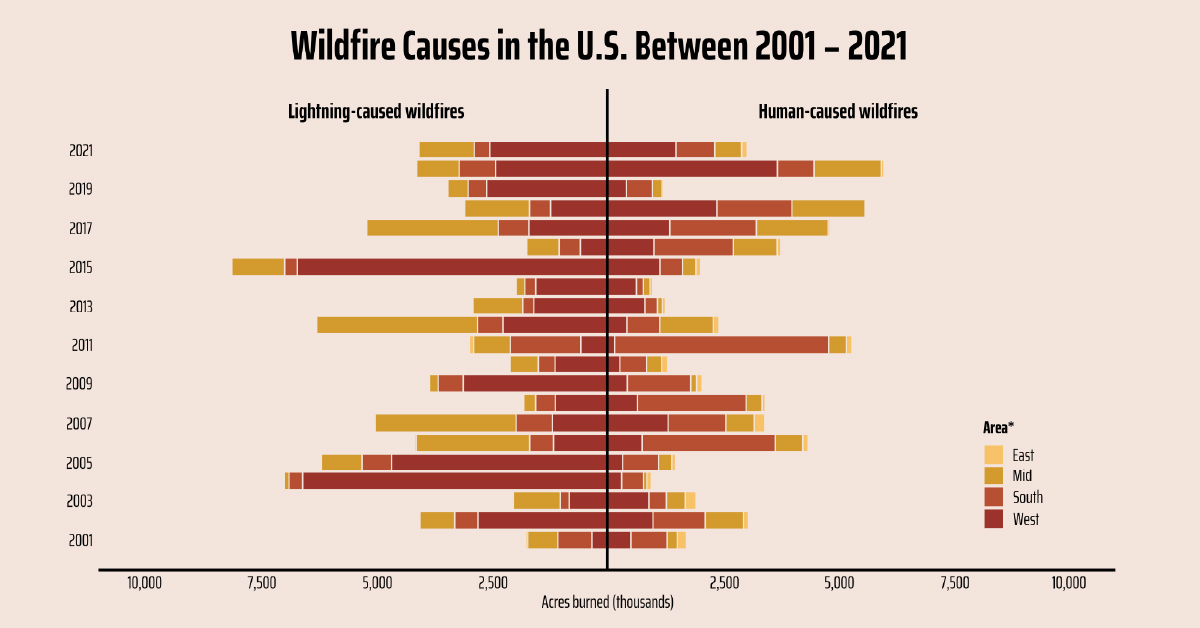
Each year, thousands of acres of land are scorched by wildfires across the United States. While most of these fires are triggered by natural causes such as lightning, some are unfortunately caused by human activity.
This graphic by Gilbert Fontana uses data from the National Interagency Fire Center (NIFC) to show the number of acres burned across the U.S. between 2001 and 2021.
| Year | Acres burned (lightning-caused fires) | Acres burned (human-caused fires) |
|---|---|---|
| 2021 | 4,101,884 | 3,023,759 |
| 2020 | 4,123,523 | 5,998,813 |
| 2019 | 3,447,038 | 1,217,324 |
| 2018 | 3,127,003 | 5,640,489 |
| 2017 | 5,195,610 | 4,830,476 |
| 2016 | 1,743,385 | 3,766,610 |
| 2015 | 8,112,688 | 2,012,461 |
| 2014 | 2,012,843 | 1,582,770 |
| 2013 | 3,057,566 | 1,261,980 |
| 2012 | 6,825,989 | 2,500,249 |
| 2011 | 3,354,596 | 5,356,771 |
| 2010 | 2,119,275 | 1,303,449 |
| 2009 | 3,849,040 | 2,072,746 |
| 2008 | 1,862,477 | 3,429,991 |
| 2007 | 5,878,691 | 3,449,360 |
| 2006 | 5,468,901 | 4,404,844 |
| 2005 | 7,168,062 | 1,521,327 |
| 2004 | 7,011,023 | 964,800 |
| 2003 | 2,038,443 | 1,922,249 |
| 2002 | 4,097,593 | 3,077,119 |
| 2001 | 1,822,600 | 1,748,661 |
Historically, we can see that lightning-caused fires have led to more damage in the U.S., and this is especially true in the West region which includes states like California, Oregon, and Washington.
That said, it’s worth noting that in three out of the six years from 2016–2021, human-caused wildfires led to more damage.

This article was published as a part of Visual Capitalist's Creator Program, which features data-driven visuals from some of our favorite Creators around the world.


Green
Ranking the Top 15 Countries by Carbon Tax Revenue
This graphic highlights France and Canada as the global leaders when it comes to generating carbon tax revenue.


Top 15 Countries by Carbon Tax Revenue
This was originally posted on our Voronoi app. Download the app for free on iOS or Android and discover incredible data-driven charts from a variety of trusted sources.
Carbon taxes are designed to discourage CO2 emissions by increasing the cost of carbon-intensive activities and incentivizing the adoption of cleaner energy alternatives.
In this graphic we list the top 15 countries by carbon tax revenue as of 2022. The data is from the World Bank’s State and Trends of Carbon Pricing Report, published in April 2023.
France and Canada Lead in Global Carbon Tax Revenue
In 2022, the top 15 countries generated approximately $30 billion in revenue from carbon taxes.
France and Canada lead in this regard, accounting for over half of the total amount. Both countries have implemented comprehensive carbon pricing systems that cover a wide range of sectors, including transportation and industry, and they have set relatively high carbon tax rates.
| Country | Government revenue in 2022 ($ billions) |
|---|---|
| 🇫🇷 France | $8.9 |
| 🇨🇦 Canada | $7.8 |
| 🇸🇪 Sweden | $2.3 |
| 🇳🇴 Norway | $2.1 |
| 🇯🇵 Japan | $1.8 |
| 🇫🇮 Finland | $1.7 |
| 🇨🇭 Switzerland | $1.6 |
| 🇬🇧 United Kingdom | $0.9 |
| 🇮🇪 Ireland | $0.7 |
| 🇩🇰 Denmark | $0.5 |
| 🇵🇹 Portugal | $0.5 |
| 🇦🇷 Argentina | $0.3 |
| 🇲🇽 Mexico | $0.2 |
| 🇸🇬 Singapore | $0.1 |
| 🇿🇦 South Africa | $0.1 |
In Canada, the total carbon tax revenue includes both national and provincial taxes.
While carbon pricing has been recognized internationally as one of the more efficient mechanisms for reducing CO2 emissions, research is divided over what the global average carbon price should be to achieve the goals of the Paris Climate Agreement, which aims to limit global warming to 1.5–2°C by 2100 relative to pre-industrial levels.
A recent study has shown that carbon pricing must be supported by other policy measures and innovations. According to a report from Queen’s University, there is no feasible carbon pricing scenario that is high enough to limit emissions sufficiently to achieve anything below 2.4°C warming on its own.

-

 Energy1 week ago
The World’s Biggest Nuclear Energy Producers
-

 Money2 weeks ago
Which States Have the Highest Minimum Wage in America?
-

 Technology2 weeks ago
Ranked: Semiconductor Companies by Industry Revenue Share
-

 Markets2 weeks ago
Ranked: The World’s Top Flight Routes, by Revenue
-

 Demographics2 weeks ago
Population Projections: The World’s 6 Largest Countries in 2075
-

 Markets2 weeks ago
The Top 10 States by Real GDP Growth in 2023
-

 Demographics2 weeks ago
The Smallest Gender Wage Gaps in OECD Countries
-

 Economy2 weeks ago
Where U.S. Inflation Hit the Hardest in March 2024