Culture
All the World’s Endangered Languages, by Country
Article/Editing:
![]() See this visualization first on the Voronoi app.
See this visualization first on the Voronoi app.
Visualizing All the Global Endangered Languages
This was originally posted on our Voronoi app. Download the app for free on iOS or Android and discover incredible data-driven charts from a variety of trusted sources.
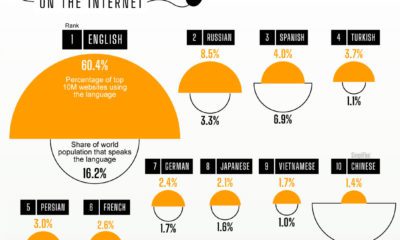
Almost half of the world’s approximately 7,000 signed and spoken languages are currently endangered.
This graphic, from Stephen Jones, CEO of Derivation.co, examines the current global landscape of languages that could become extinct.
Almost 90 million Speak Languages at Risk of Extinction
An extinct language is one that no longer has any first-language or second-language speakers.
In modern times, languages have usually become extinct due to cultural assimilation, leading to language shift, and the gradual abandonment of a native language in favor of a foreign language, primarily those of European countries.
For instance, numerous Native American languages were supplanted by English, French, Portuguese, Spanish, or Dutch due to European colonization of the Americas.
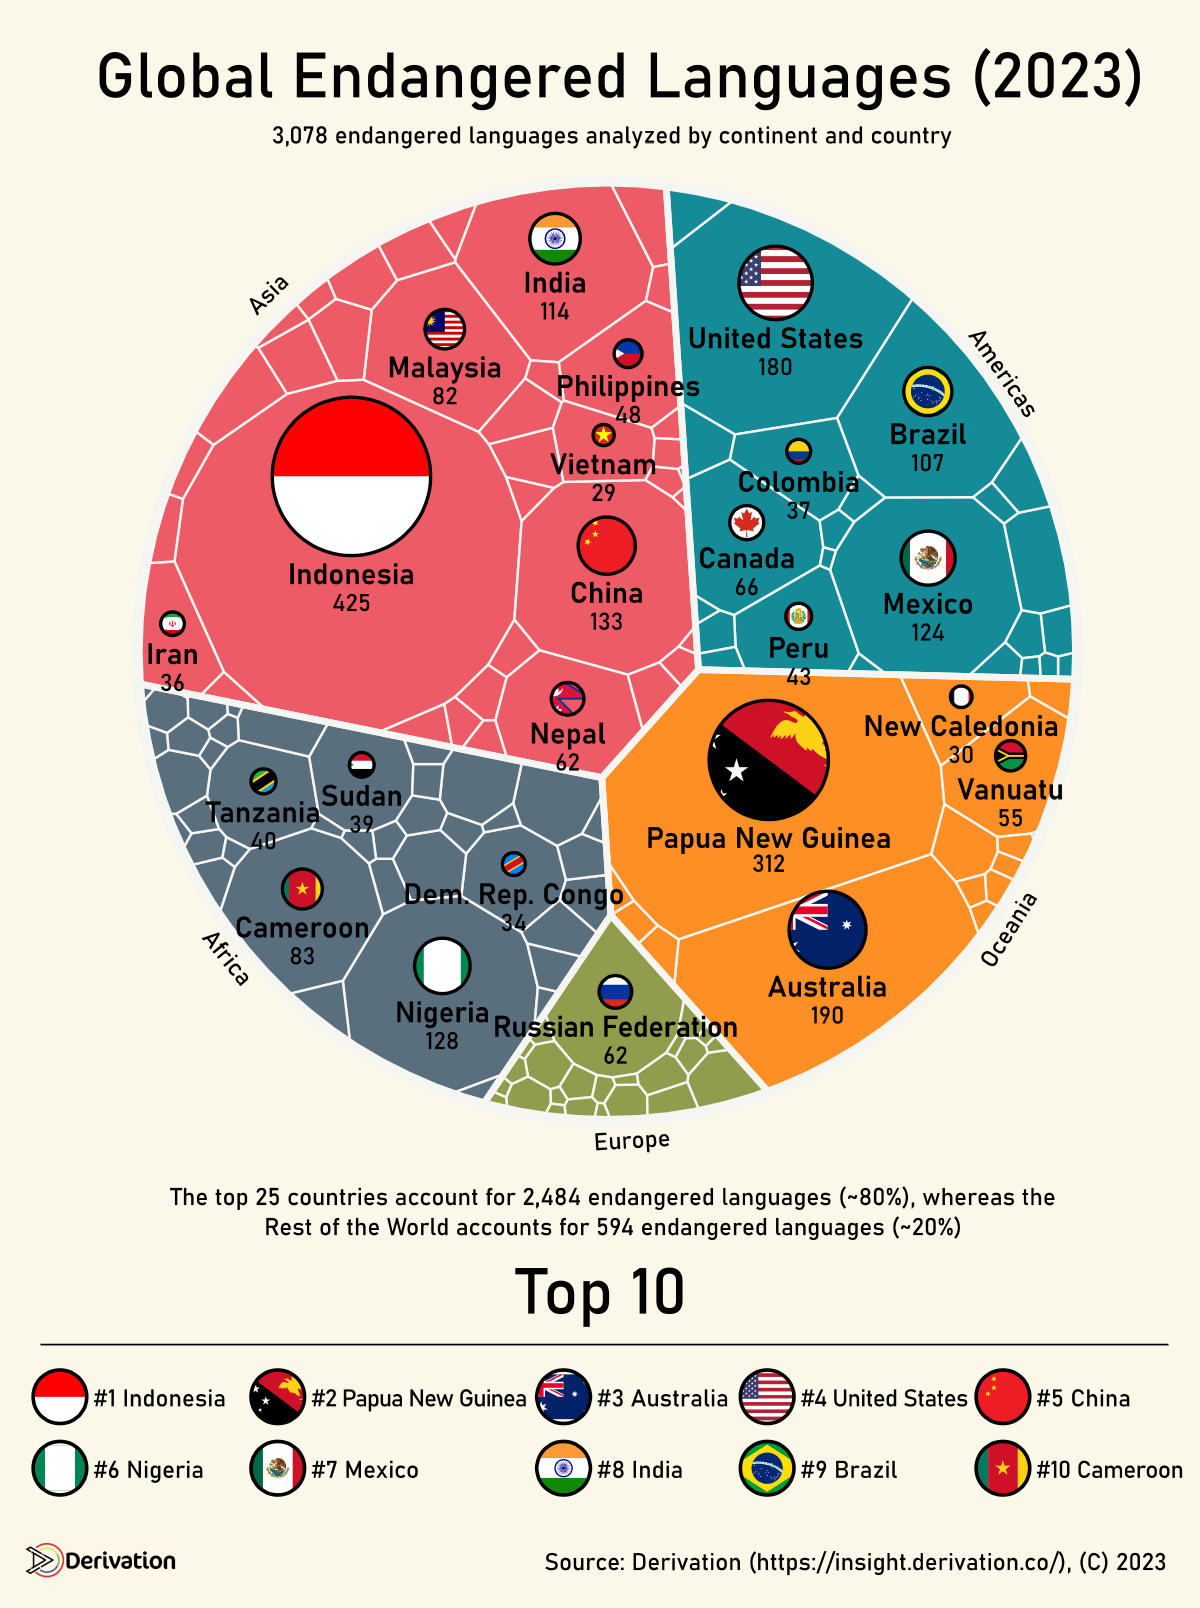
Currently, out of the world’s 7,168 living languages, 3,078 (43%) are classified as Endangered. Over 88 million people speak languages at risk of extinction.
| Locations | Endangered Languages |
|---|---|
| 🇮🇩 Indonesia | 425 |
| 🇵🇬 Papua New Guinea | 312 |
| 🇦🇺 Australia | 190 |
| 🇺🇸 United States | 180 |
| 🇨🇳 China | 133 |
| 🇳🇬 Nigeria | 128 |
| 🇲🇽 Mexico | 124 |
| 🇮🇳 India | 114 |
| 🇧🇷 Brazil | 107 |
| 🇨🇲 Cameroon | 83 |
| 🇲🇾 Malaysia | 82 |
| 🇨🇦 Canada | 66 |
| 🇳🇵 Nepal | 62 |
| 🇷🇺 Russian Federation | 62 |
| 🇻🇺 Vanuatu | 55 |
| 🇵🇭 Philippines | 48 |
| 🇵🇪 Peru | 43 |
| 🇹🇿 Tanzania | 40 |
| 🇸🇩 Sudan | 39 |
| 🇨🇴 Colombia | 37 |
| 🇮🇷 Iran | 36 |
| 🇨🇩 Democratic Republic of the Congo | 34 |
| 🇳🇨 New Caledonia | 30 |
| 🇻🇳 Vietnam | 29 |
| 🇧🇴 Bolivia | 25 |
| 🌐 Rest of the world | 594 |
| Total | 3078 |
Additionally, 100 of them face the genuine threat of extinction within a few decades if no action is taken.
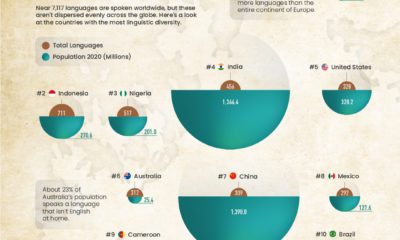
While every language matters to the individuals speaking, writing, and signing them across the planet, 80% of endangered languages (2,484) exist within just 25 countries.
Of those, the top four countries alone – Indonesia (425), Papua New Guinea (312), Australia (190), and the U.S. (180) – account for well over a thousand endangered languages.
Just as during the colonization period, the majority of endangered languages are spoken in Indigenous communities, putting their inherent culture and knowledge at risk of loss.
Languages, however, can be revitalized.
Over the last 50 years, for example, government support to teach native languages in schools has helped increase the number of speakers of the Māori language in New Zealand, and Hawaiian in the American state.
Advancements in AI are also providing tools to preserve languages.

This article was published as a part of Visual Capitalist's Creator Program, which features data-driven visuals from some of our favorite Creators around the world.


Brands
How Tech Logos Have Evolved Over Time
From complete overhauls to more subtle tweaks, these tech logos have had quite a journey. Featuring: Google, Apple, and more.


How Tech Logos Have Evolved Over Time
This was originally posted on our Voronoi app. Download the app for free on iOS or Android and discover incredible data-driven charts from a variety of trusted sources.
One would be hard-pressed to find a company that has never changed its logo. Granted, some brands—like Rolex, IBM, and Coca-Cola—tend to just have more minimalistic updates. But other companies undergo an entire identity change, thus necessitating a full overhaul.
In this graphic, we visualized the evolution of prominent tech companies’ logos over time. All of these brands ranked highly in a Q1 2024 YouGov study of America’s most famous tech brands. The logo changes are sourced from 1000logos.net.
How Many Times Has Google Changed Its Logo?
Google and Facebook share a 98% fame rating according to YouGov. But while Facebook’s rise was captured in The Social Network (2010), Google’s history tends to be a little less lionized in popular culture.
For example, Google was initially called “Backrub” because it analyzed “back links” to understand how important a website was. Since its founding, Google has undergone eight logo changes, finally settling on its current one in 2015.
| Company | Number of Logo Changes |
|---|---|
| 8 | |
| HP | 8 |
| Amazon | 6 |
| Microsoft | 6 |
| Samsung | 6 |
| Apple | 5* |
Note: *Includes color changes. Source: 1000Logos.net
Another fun origin story is Microsoft, which started off as Traf-O-Data, a traffic counter reading company that generated reports for traffic engineers. By 1975, the company was renamed. But it wasn’t until 2012 that Microsoft put the iconic Windows logo—still the most popular desktop operating system—alongside its name.
And then there’s Samsung, which started as a grocery trading store in 1938. Its pivot to electronics started in the 1970s with black and white television sets. For 55 years, the company kept some form of stars from its first logo, until 1993, when the iconic encircled blue Samsung logo debuted.
Finally, Apple’s first logo in 1976 featured Isaac Newton reading under a tree—moments before an apple fell on his head. Two years later, the iconic bitten apple logo would be designed at Steve Jobs’ behest, and it would take another two decades for it to go monochrome.

-

 Education1 week ago
How Hard Is It to Get Into an Ivy League School?
-

 Technology2 weeks ago
Ranked: Semiconductor Companies by Industry Revenue Share
-

 Markets2 weeks ago
Ranked: The World’s Top Flight Routes, by Revenue
-

 Demographics2 weeks ago
Population Projections: The World’s 6 Largest Countries in 2075
-

 Markets2 weeks ago
The Top 10 States by Real GDP Growth in 2023
-

 Demographics2 weeks ago
The Smallest Gender Wage Gaps in OECD Countries
-

 Economy2 weeks ago
Where U.S. Inflation Hit the Hardest in March 2024
-

 Green2 weeks ago
Top Countries By Forest Growth Since 2001