Technology
The COVID-19 Impact on App Popularity


The COVID-19 Impact on App Popularity
Pandemic-induced social isolation has altered the relationship consumers have with technology.
With the physical world now slowly receding, consumers are suddenly more reliant on apps for communication, shopping, staying healthy, and entertainment.
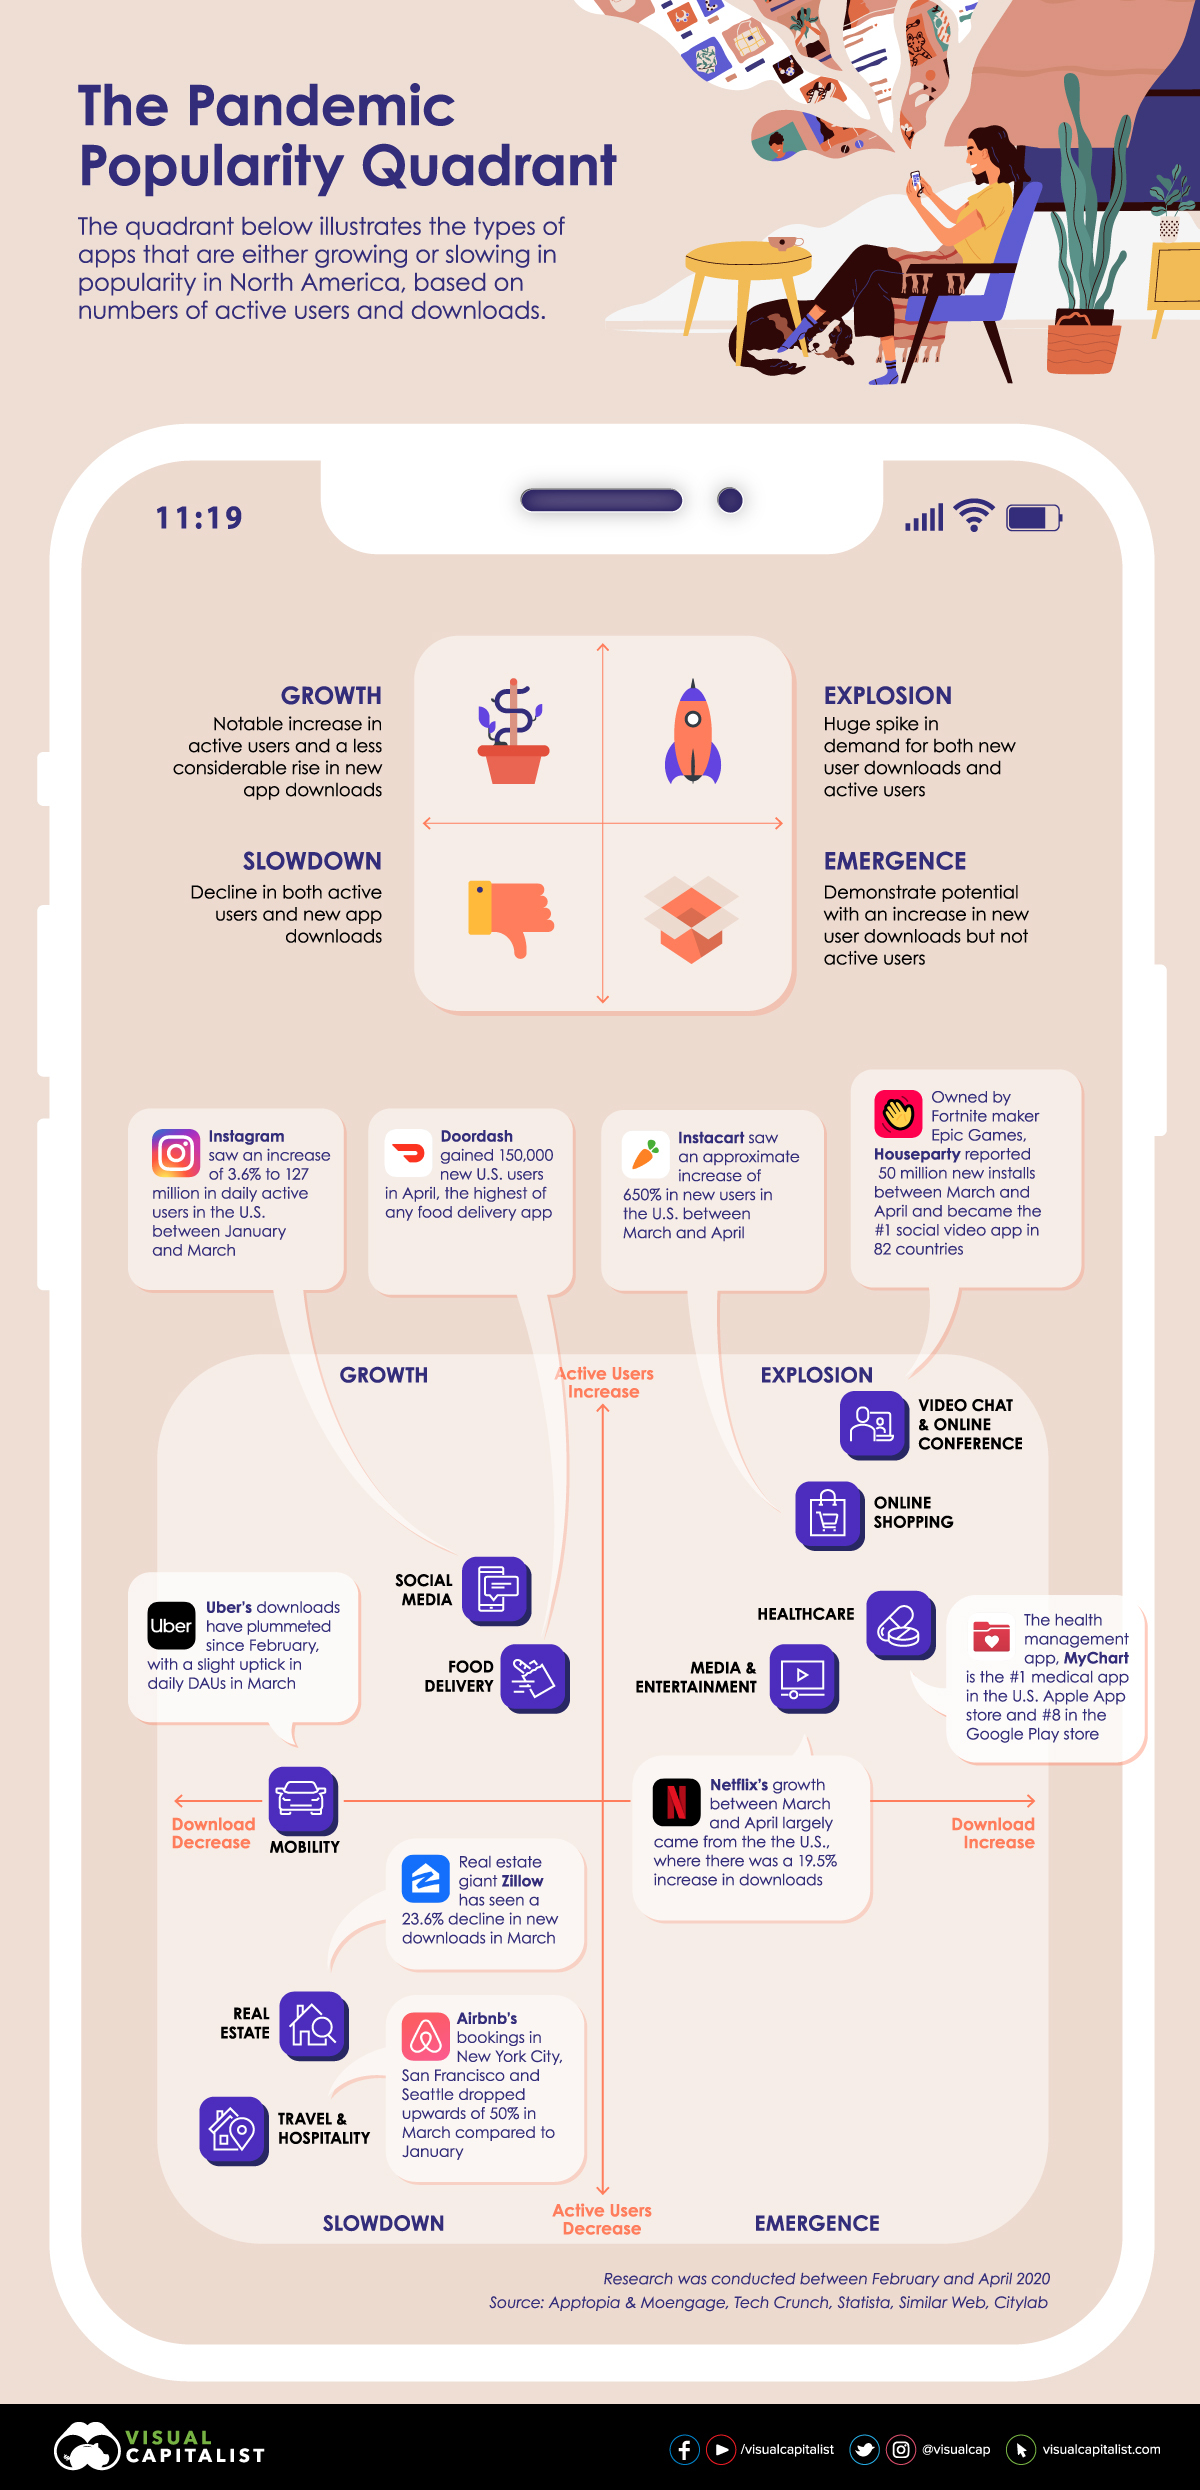
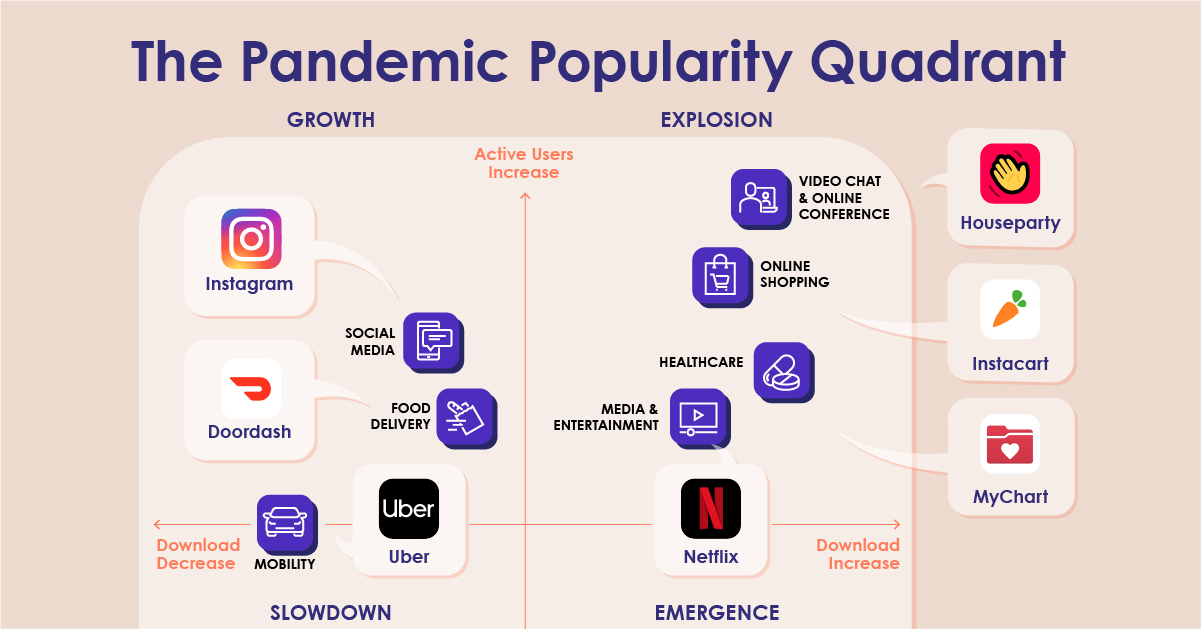
Today’s graphic pulls data from a new report by MoEngage and Apptopia, and it plots the winners and losers of the pandemic from the app world in North America.
Embracing the App Economy with Open Arms
Consumers are looking for different ways to manage their lives while in lockdown, and in some cases, apps could provide the perfect solution.
In fact, people spent 20% more time using apps in the first quarter of 2020 compared to 2019. During that time, consumers also spent over $23 billion in app stores—the largest spend per quarter recorded to date.
While consumers across the globe lean on apps to support them in times of crisis, what exactly are consumers in North America using?
Climbing to the Top
Given the sheer volume of people working remotely, it’s no surprise to see video chat and online conference apps experiencing explosive growth. In North America, these apps witnessed an astronomical 627% increase in downloads, and a 121% increase in daily active users (DAUs).
Video conferencing app Zoom expanded its worldwide user base by 300% in just under a month. Upwards of 500 participants can attend a meeting at any one time, hence why it has become a popular option for virtual conferences, festivals and even religious sermons. As we adapt to life indoors, the Zoom boom shows no signs of slowing, even despite the app’s recent data privacy and security scandal.
Slowing to a Standstill
Unfortunately, indoor living is not conducive to globetrotting. As travel and hospitality app downloads in North America decline by 12%, this is the harsh reality that the industry needs to come to terms with for the foreseeable future.
Interestingly, airlines in the U.S. did not see a reduction in app downloads until early March, which may be attributed to the later timing of the COVID-19 shutdowns as in comparison to other countries around the world.
In the short-term rentals space, Airbnb has experienced a drastic decline in bookings, and is adopting new cleaning protocols in an attempt to appease both hosts and guests. The tech company has since lowered its internal evaluation, from $31 billion to $26 billion, which could disrupt the company’s plan to go public in 2020.
Emerging Victorious
Because the largest social media networks already boast a significantly large audience, new downloads is not necessarily a metric that could make or break this cohort. Instead, DAUs are a much better indicator of success, and from what the report suggests, people have become more devoted to these platforms.
For U.S. adults, social media usage jumped from 20% of total mobile app usage in the early part of the year, to 25% in mid-March. In fact, between January and March, daily active users on Instagram and Facebook rose to 127 million and 195 million, respectively.
Measuring the Global Impact
When we look at the popularity of apps across different parts of the world, some interesting observations appear. First of all, healthcare apps in South East Asia are categorized as emerging—meaning they show promise, but have minimal active users.
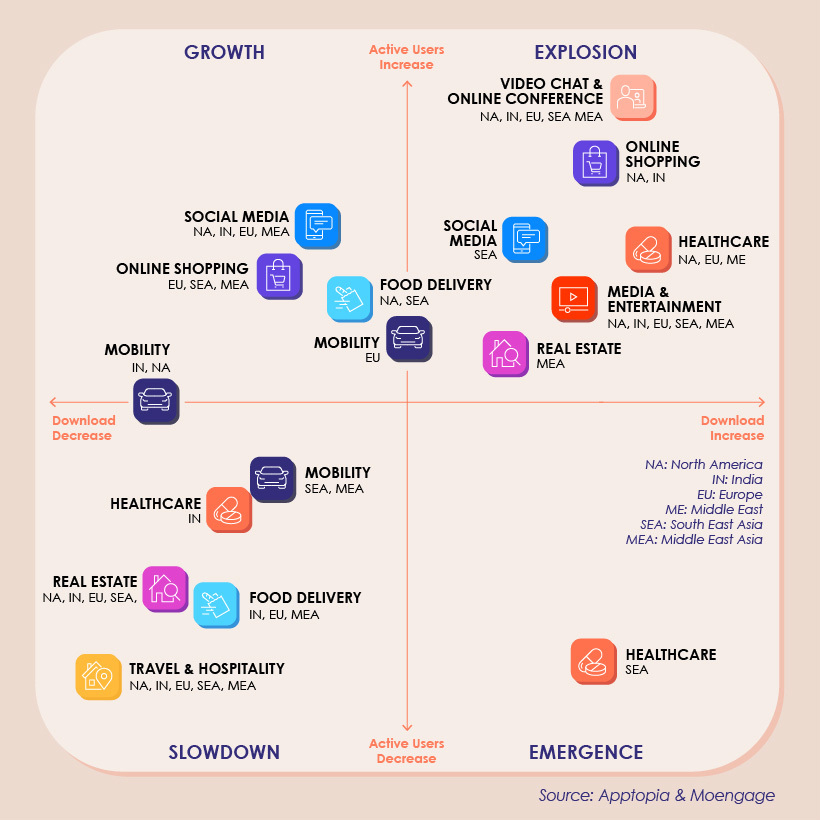
Although DAUs of healthcare apps in South East Asia are declining, fascinatingly, there has been a 110% increase in spend on these apps during the outbreak. The report suggests that this could be attributed to the user base becoming more loyal as a result of trust-building advertising campaigns in this space.
Real estate is a sector seeing a simultaneous increase and decrease in users worldwide. In Middle-East Asia for instance, these apps are exploding in popularity, but in other parts of the world they are experiencing a slowdown. This could be due to restrictions in certain parts of the world slowly starting to lift.
An Unsung Hero
Technology is becoming an increasingly divisive topic. Data security scandals, the spread of false information, and its impact on mental health are just some of the reasons why technology’s role in society regularly comes into question.
However, it has allowed us to remain connected in a time of crisis, and has also been pivotal in facilitating the spread of reliable information during lockdown.
If anything, the pandemic has shown us how vulnerable we are without technology—and how instrumental apps are in keeping us busy, informed, and sane.


Technology
Countries With the Highest Rates of Crypto Ownership
While the U.S. is a major market for cryptocurrencies, two countries surpass it in terms of their rates of crypto ownership.


Countries With the Highest Rates of Crypto Ownership
This was originally posted on our Voronoi app. Download the app for free on iOS or Android and discover incredible data-driven charts from a variety of trusted sources.
This graphic ranks the top 10 countries by their rate of cryptocurrency ownership, which is the percentage of the population that owns crypto. These figures come from crypto payment gateway, Triple-A, and are as of 2023.
Data and Highlights
The table below lists the rates of crypto ownership in the top 10 countries, as well as the number of people this amounts to.
| Country | % of Population Who Own Crypto | # of Crypto Owners |
|---|---|---|
| 🇦🇪 United Arab Emirates | 30.4 | 3M |
| 🇻🇳 Vietnam | 21.2 | 21M |
| 🇺🇸 U.S. | 15.6 | 53M |
| 🇮🇷 Iran | 13.5 | 12M |
| 🇵🇭 Philippines | 13.4 | 16M |
| 🇧🇷 Brazil | 12 | 26M |
| 🇸🇦 Saudi Arabia | 11.4 | 4M |
| 🇸🇬 Singapore | 11.1 | 665K |
| 🇺🇦 Ukraine | 10.6 | 4M |
| 🇻🇪 Venezuela | 10.3 | 3M |
Note that if we were to rank countries based on their actual number of crypto owners, India would rank first at 93 million people, China would rank second at 59 million people, and the U.S. would rank third at 52 million people.
The UAE Takes the Top Spot
The United Arab Emirates (UAE) boasts the highest rates of crypto ownership globally. The country’s government is considered to be very crypto friendly, as described in Henley & Partners’ Crypto Wealth Report 2023:
In the UAE, the Financial Services Regulatory Authority (FSRA-ADGM) was the first to provide rules and regulations regarding cryptocurrency purchasing and selling. The Emirates are generally very open to new technologies and have proposed zero taxes for crypto owners and businesses.
Vietnam leads Southeast Asia
According to the Crypto Council for Innovation, cryptocurrency holdings in Vietnam are also untaxed, making them an attractive asset.
Another reason for Vietnam’s high rates of ownership could be its large unbanked population (people without access to financial services). Cryptocurrencies may provide an alternative means of accessing these services without relying on traditional banks.
Learn More About Crypto From Visual Capitalist
If you enjoyed this post, be sure to check out The World’s Largest Corporate Holders of Bitcoin, which ranks the top 12 publicly traded companies by their Bitcoin holdings.

-

 Markets6 days ago
Visualized: Interest Rate Forecasts for Advanced Economies
-

 Economy2 weeks ago
Economic Growth Forecasts for G7 and BRICS Countries in 2024
-

 Wealth2 weeks ago
Charted: Which City Has the Most Billionaires in 2024?
-

 Technology2 weeks ago
All of the Grants Given by the U.S. CHIPS Act
-

 Green2 weeks ago
The Carbon Footprint of Major Travel Methods
-

 United States1 week ago
Visualizing the Most Common Pets in the U.S.
-

 Culture1 week ago
The World’s Top Media Franchises by All-Time Revenue
-

 voronoi1 week ago
Best Visualizations of April on the Voronoi App