Markets
The Hardest Hit Companies of the COVID-19 Downturn: The ‘BEACH’ Stocks
 Can I share this graphic?
 When do I need a license?
 Interested in this piece?
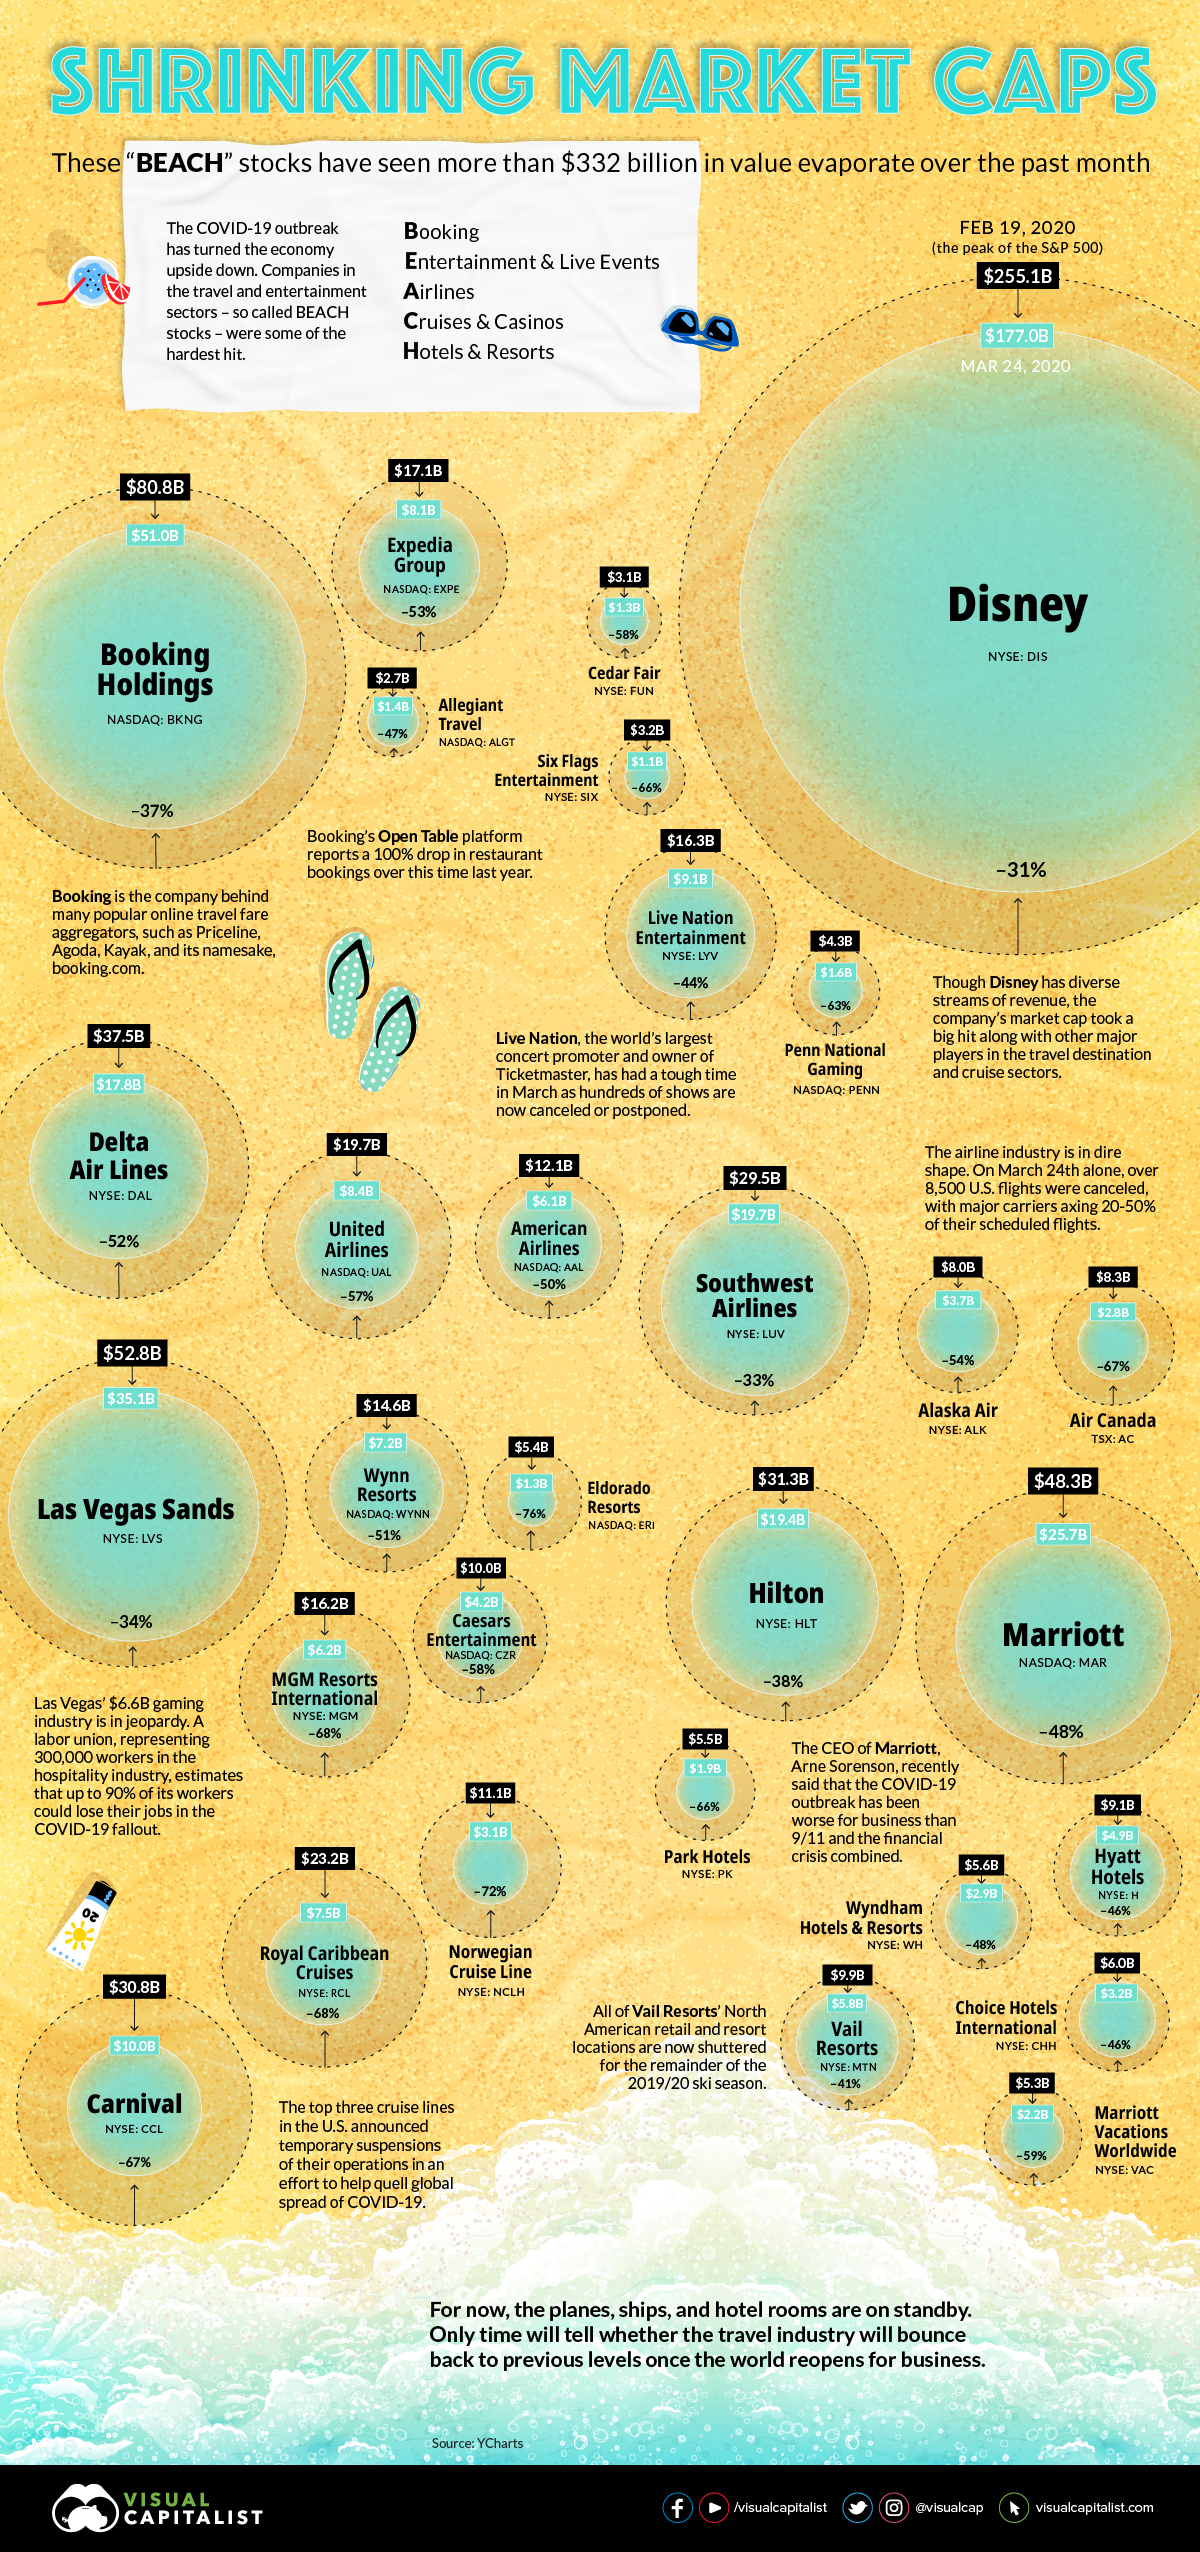
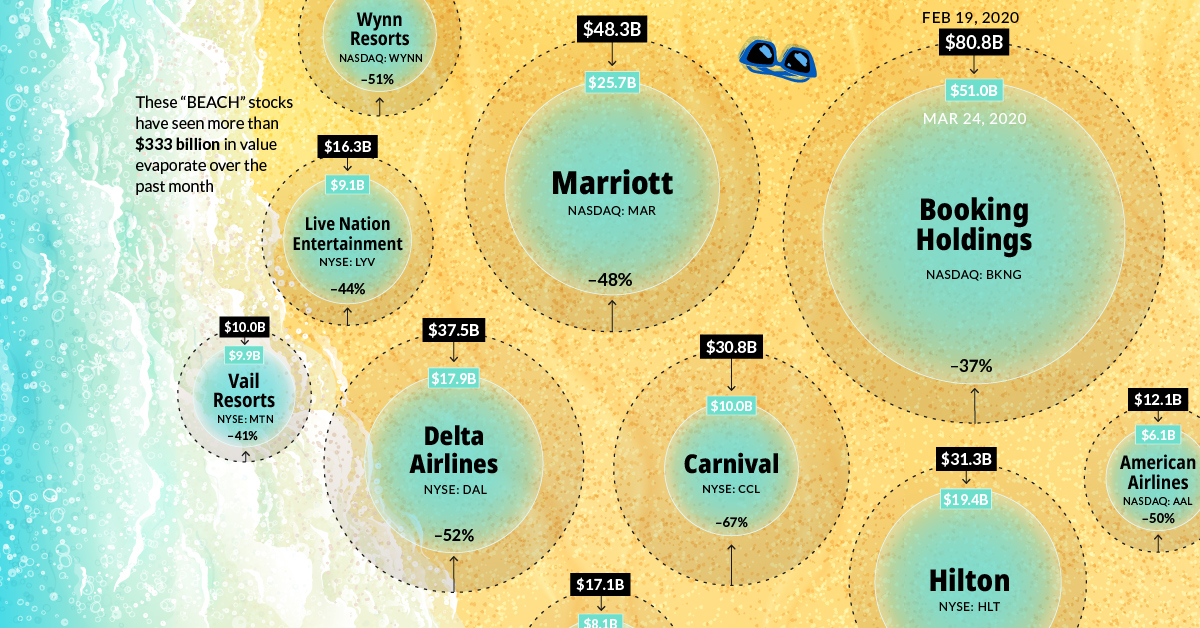
BEACH Stocks: $332B in Value Washed Away
The market’s latest storm has plunged the global travel industry into uncharted territory.
Since the S&P 500 market high on February 19, 2020, market capitalizations across BEACH industries—booking, entertainment, airlines, cruises, and hotels—have tumbled. The global airline industry alone has seen $157B wiped off valuations across 116 publicly traded airlines.
Investor confidence in cruise lines has also dropped. Between Carnival, Royal Caribbean, and Norwegian Cruise Line Holdings, over half of their market value has evaporated—equal to at least $42B in combined market capitalization.
Today’s infographic profiles the steep losses across BEACH companies. It looks at the ripple effects across individual companies and industries from the February 19 peak to date*.
*All numbers as of market close on March 24, 2020
Falling Off A Cliff
As the COVID-19 pandemic has spread to over 100 countries, many governments have implemented sweeping travel restrictions.
The impact across BEACH industries is far-reaching, with some valuations declining to nearly a quarter of their previous total.
| Company | Ticker | Category | Market Cap: 02/19/2020 | Market Cap: 03/24/2020 | % Change |
|---|---|---|---|---|---|
| Booking Holdings | BKNG | Booking | $80.8B | $51B | -37% |
| Expedia Group | EXPE | Booking | $17.1B | $8.1B | -53% |
| Allegiant Travel | ALGT | Booking | $2.7B | $1.4B | -47% |
| Live Nation | LYV | Entertainment & Live Events | $16.3B | $9.1B | -44% |
| Six Flags | SIX | Entertainment & Live Events | $3.2B | $1.1B | -66% |
| Cedar Fair | FUN | Entertainment & Live Events | $3.1B | $1.3B | -58% |
| The Walt Disney Co | DIS | Entertainment & Live Events | $255.1B | $177B | -31% |
| Penn National Gaming | PENN | Entertainment & Live Events | $4.3B | $1.6B | -63% |
| Delta Air Lines | DAL | Airlines | $37.5B | $17.8B | -52% |
| United Airlines | UAL | Airlines | $19.7B | $8.4B | -57% |
| American Airlines | AAL | Airlines | $12.1B | $6.1B | -50% |
| Southwest Airlines | LUV | Airlines | $29.5B | $19.7B | -33% |
| Alaska Air Group | ALK | Airlines | $8B | $3.7B | -54% |
| Air Canada (in USD) | AC | Airlines | $8.3B | $2.8B | -67% |
| Carnival | CCL | Cruise & Casino | $30.8B | $10B | -67% |
| Royal Caribbean Cruises | RCL | Cruise & Casino | $23.2B | $7.5B | -68% |
| Norwegian Cruise Lines | NCLH | Cruise & Casino | $11.1B | $3.1B | -72% |
| Las Vegas Sands | LVS | Cruise & Casino | $52.8B | $35.1B | -34% |
| MGM Resorts International | MGM | Cruise & Casino | $16.2B | $6.2B | -68% |
| Wynn Resorts | WYNN | Cruise & Casino | $14.6B | $7.2B | -51% |
| Caesars Entertainment | CZR | Cruise & Casino | $10B | $4.2B | -58% |
| Eldorado Resorts | ERI | Cruise & Casino | $5.4B | $1.3B | -76% |
| Marriott International | MAR | Hotels & Resorts | $48.3B | $25.7B | -48% |
| Hilton | HLT | Hotels & Resorts | $31.3B | $19.4B | -38% |
| Hyatt Hotels | H | Hotels & Resorts | $9.1B | $4.9B | -46% |
| Choice Hotels International | CHH | Hotels & Resorts | $6B | $3.2B | -46% |
| Wyndham Hotels & Resorts | WH | Hotels & Resorts | $5.6B | $2.9B | -48% |
| Park Hotels | PK | Hotels & Resorts | $5.5B | $1.9B | -66% |
| Vail Resorts | MTN | Hotels & Resorts | $9.98B | $5.8B | -41% |
| Marriott Vacations Worldwide | VAC | Hotels & Resorts | $5.3B | $2.2B | -59% |
For instance, the consequences on various travel bookings brands have been severe. Booking Holdings, the parent company to Booking.com, Priceline, Kayak and OpenTable, witnessed share price declines of over 35% since the peak.
Empty Stadiums
Across the entertainment industry, ticket sales for concerts, movies, and other events are falling precipitously due to cancellations or postponements.
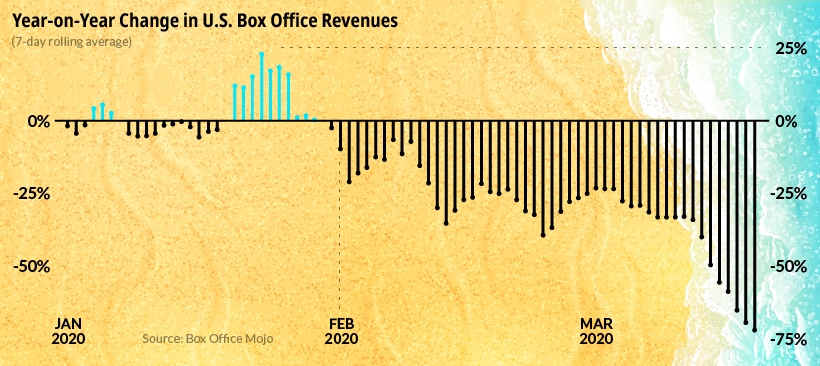
Upwards of $5B in global film industry losses could result from the COVID-19 pandemic.
Chilling footage of the Las Vegas strip, as well as other tourist epicenters around the world, shows deserted streets as visitors opt to stay home instead.
Bracing For Impact
Meanwhile, worldwide airline revenue is estimated to fall by as much as $113B in 2020.
In under two months, the share price of Delta Airlines has fallen over 50% as the company anticipates a capacity reduction of 40%, the largest in its history.
| Company | Ticker | Feb 19 2020 Share Price | Mar 24 2020 Share Price |
|---|---|---|---|
| Delta Air Lines | NYSE:DAL | $58.5 | $26.9 |
| United Airlines | NASDAQ:UAL | $79.4 | $33 |
| American Airlines | NASDAQ:AAL | $28.3 | $13.9 |
| Southwest Airlines | NYSE:LUV | $56.89 | $37.7 |
| Alaska Air Group | NYSE:ALK | $65.2 | $28.9 |
| Air Canada (in CAD) | TSX:AC | $45.3 | $15.1 |
The global airline industry—which employs over 10M people—supports $2.7T in global economic activity across an average of 12M passengers per day.
Aruba, Jamaica No More
As for the cruise line industry, global operations came to a 30-day standstill in mid-March. Over 800 COVID-19 cases and 10 deaths across three cruise ships have been discovered.
“COVID-19 on cruise ships poses a risk for rapid spread of disease, causing outbreaks in a vulnerable population, and aggressive efforts are required to contain spread.”
—CDC
Carnival, a Miami-based company, has witnessed its share price fall to around one third of its February 19 value. Similarly, Royal Caribbean Cruises, which has seen its market cap plummet almost 70%, announced that it will suspend trips until mid-May.
Occupancy Dilemma
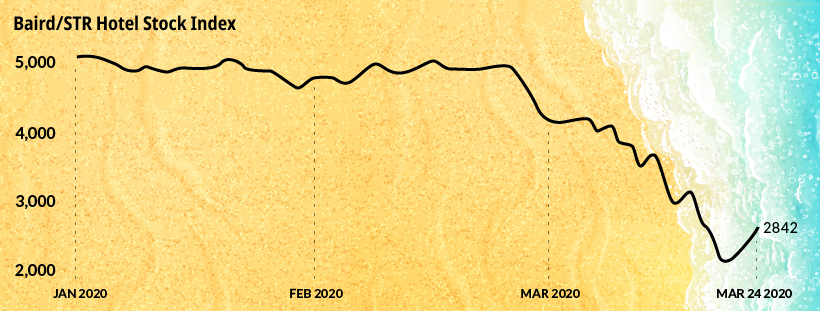
As the hotel industry is impacted by the global outbreak, share prices have also realized a significant slump. In the U.S., an estimated $1.4B in revenue is vanishing each week. If occupancy levels fall by just 30% this year, the U.S. hotel industry could see approximately 4 million jobs wiped out.
The Baird/STR Hotel Stock Index, which serves as a benchmark for the sector’s overall health, has declined over 47% year-to-date.
Global Stimulus Response
A number of travel industries around the world are calling for stimulus packages.
On March 25, the U.S. Congress finalized a historic $2T deal, which includes $25B in grants for the airline industry. In the UK, officials are providing small businesses in hospitality and leisure grants that are worth up to $30,000 as part of its $400B bailout plan.
China, Germany, Italy, and Spain have outlined multibillion dollar proposals in response to COVID-19. Overall, at least eleven countries have announced stimulus plans along with the European Commission and the IMF.
When Will the Travel Wave Hit Again?
Amid the COVID-19 pandemic one thing is clear: the impact on the travel industry will have a marked effect on the broader economy.
Travel is closely linked with oil, as transportation accounts for over 60% of global demand. In Q2 2020, global oil consumption is projected to fall by 25M barrels per day.
Along with this, discretionary consumer spending makes up over one third of America’s GDP. The impact of the pandemic across this sector is expected to contribute to a 10% decline or more in U.S. GDP for the second quarter.
As conditions materially improve around the world—with China beginning to open up flights—positive signs are emerging from under the surface. Will BEACH industries quickly bounce back as infection rates drop, or will a slow and painful recovery unfold in the months ahead?


Markets
The European Stock Market: Attractive Valuations Offer Opportunities
On average, the European stock market has valuations that are nearly 50% lower than U.S. valuations. But how can you access the market?


European Stock Market: Attractive Valuations Offer Opportunities
Europe is known for some established brands, from L’Oréal to Louis Vuitton. However, the European stock market offers additional opportunities that may be lesser known.
The above infographic, sponsored by STOXX, outlines why investors may want to consider European stocks.
Attractive Valuations
Compared to most North American and Asian markets, European stocks offer lower or comparable valuations.
| Index | Price-to-Earnings Ratio | Price-to-Book Ratio |
|---|---|---|
| EURO STOXX 50 | 14.9 | 2.2 |
| STOXX Europe 600 | 14.4 | 2 |
| U.S. | 25.9 | 4.7 |
| Canada | 16.1 | 1.8 |
| Japan | 15.4 | 1.6 |
| Asia Pacific ex. China | 17.1 | 1.8 |
Data as of February 29, 2024. See graphic for full index names. Ratios based on trailing 12 month financials. The price to earnings ratio excludes companies with negative earnings.
On average, European valuations are nearly 50% lower than U.S. valuations, potentially offering an affordable entry point for investors.
Research also shows that lower price ratios have historically led to higher long-term returns.
Market Movements Not Closely Connected
Over the last decade, the European stock market had low-to-moderate correlation with North American and Asian equities.
The below chart shows correlations from February 2014 to February 2024. A value closer to zero indicates low correlation, while a value of one would indicate that two regions are moving in perfect unison.
| EURO STOXX 50 | STOXX EUROPE 600 | U.S. | Canada | Japan | Asia Pacific ex. China |
|
|---|---|---|---|---|---|---|
| EURO STOXX 50 | 1.00 | 0.97 | 0.55 | 0.67 | 0.24 | 0.43 |
| STOXX EUROPE 600 | 1.00 | 0.56 | 0.71 | 0.28 | 0.48 | |
| U.S. | 1.00 | 0.73 | 0.12 | 0.25 | ||
| Canada | 1.00 | 0.22 | 0.40 | |||
| Japan | 1.00 | 0.88 | ||||
| Asia Pacific ex. China | 1.00 |
Data is based on daily USD returns.
European equities had relatively independent market movements from North American and Asian markets. One contributing factor could be the differing sector weights in each market. For instance, technology makes up a quarter of the U.S. market, but health care and industrials dominate the broader European market.
Ultimately, European equities can enhance portfolio diversification and have the potential to mitigate risk for investors.
Tracking the Market
For investors interested in European equities, STOXX offers a variety of flagship indices:
| Index | Description | Market Cap |
|---|---|---|
| STOXX Europe 600 | Pan-regional, broad market | €10.5T |
| STOXX Developed Europe | Pan-regional, broad-market | €9.9T |
| STOXX Europe 600 ESG-X | Pan-regional, broad market, sustainability focus | €9.7T |
| STOXX Europe 50 | Pan-regional, blue-chip | €5.1T |
| EURO STOXX 50 | Eurozone, blue-chip | €3.5T |
Data is as of February 29, 2024. Market cap is free float, which represents the shares that are readily available for public trading on stock exchanges.
The EURO STOXX 50 tracks the Eurozone’s biggest and most traded companies. It also underlies one of the world’s largest ranges of ETFs and mutual funds. As of November 2023, there were €27.3 billion in ETFs and €23.5B in mutual fund assets under management tracking the index.
“For the past 25 years, the EURO STOXX 50 has served as an accurate, reliable and tradable representation of the Eurozone equity market.”
— Axel Lomholt, General Manager at STOXX
Partnering with STOXX to Track the European Stock Market
Are you interested in European equities? STOXX can be a valuable partner:
- Comprehensive, liquid and investable ecosystem
- European heritage, global reach
- Highly sophisticated customization capabilities
- Open architecture approach to using data
- Close partnerships with clients
- Part of ISS STOXX and Deutsche Börse Group
With a full suite of indices, STOXX can help you benchmark against the European stock market.
Learn how STOXX’s European indices offer liquid and effective market access.

-

 Economy2 days ago
Economic Growth Forecasts for G7 and BRICS Countries in 2024
The IMF has released its economic growth forecasts for 2024. How do the G7 and BRICS countries compare?
-

 Markets1 week ago
U.S. Debt Interest Payments Reach $1 Trillion
U.S. debt interest payments have surged past the $1 trillion dollar mark, amid high interest rates and an ever-expanding debt burden.
-

 United States2 weeks ago
Ranked: The Largest U.S. Corporations by Number of Employees
We visualized the top U.S. companies by employees, revealing the massive scale of retailers like Walmart, Target, and Home Depot.
-

 Markets2 weeks ago
The Top 10 States by Real GDP Growth in 2023
This graphic shows the states with the highest real GDP growth rate in 2023, largely propelled by the oil and gas boom.
-

 Markets2 weeks ago
Ranked: The World’s Top Flight Routes, by Revenue
In this graphic, we show the highest earning flight routes globally as air travel continued to rebound in 2023.
-

 Markets2 weeks ago
Ranked: The Most Valuable Housing Markets in America
The U.S. residential real estate market is worth a staggering $47.5 trillion. Here are the most valuable housing markets in the country.

-

 Education1 week ago
How Hard Is It to Get Into an Ivy League School?
-

 Technology2 weeks ago
Ranked: Semiconductor Companies by Industry Revenue Share
-
Markets2 weeks ago
Ranked: The World’s Top Flight Routes, by Revenue
-

 Demographics2 weeks ago
Population Projections: The World’s 6 Largest Countries in 2075
-
Markets2 weeks ago
The Top 10 States by Real GDP Growth in 2023
-

 Demographics2 weeks ago
The Smallest Gender Wage Gaps in OECD Countries
-

 Economy2 weeks ago
Where U.S. Inflation Hit the Hardest in March 2024
-

 Environment2 weeks ago
Top Countries By Forest Growth Since 2001