Markets
China’s Economy: The Sum of the Parts
China’s Economy: The Sum of the Parts
Click here to view the infographic at full size.
Geographically vast countries such as the United States or Canada have incredible diversity within their borders. Every part of the country appears unique, as the distribution of population, culture, geographical features, natural resources, and regional industries vary from place to place.
Think of the differences within the U.S. alone: Silicon Valley is known for its technology and dry weather, while New York City is diverse and busy financial hub. Detroit and the other cities situated in the Great Lake States are all known for manufacturing. Meanwhile, Alaska is a center for natural resources, providing the rest of the country with much of its energy, fishing, and metal resources.
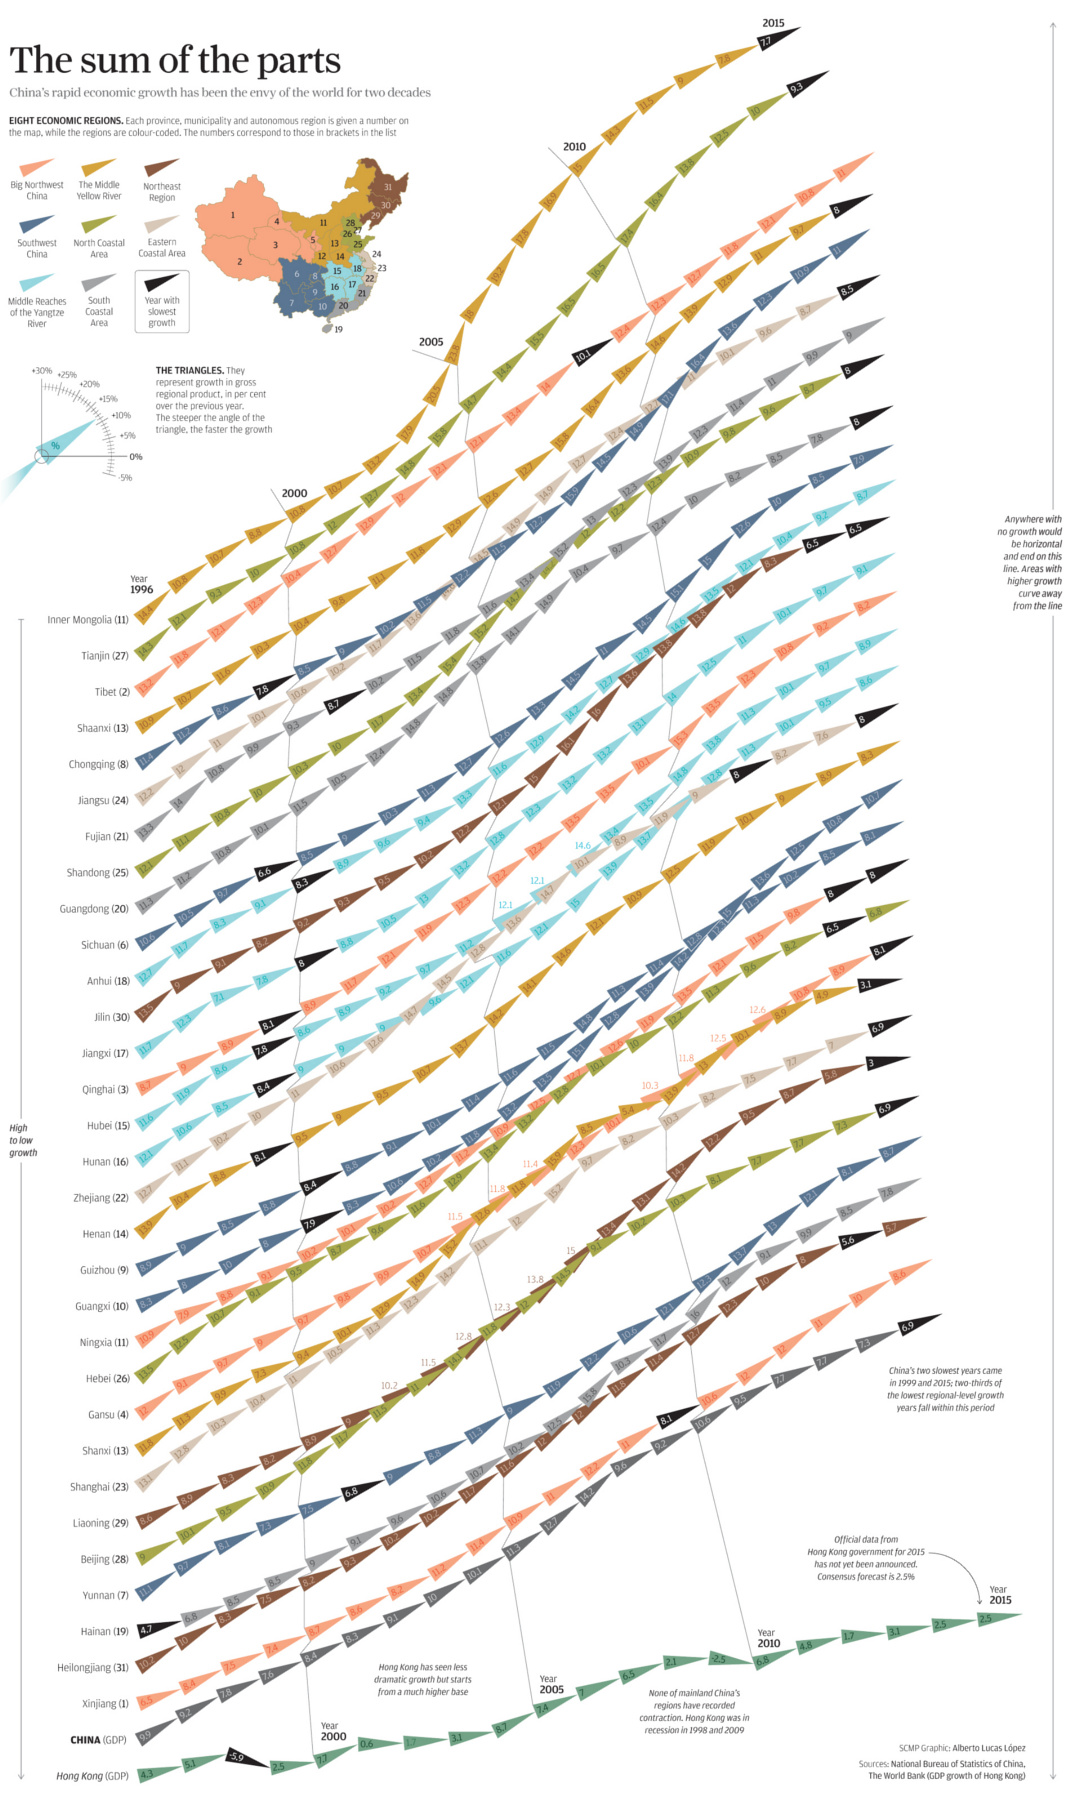
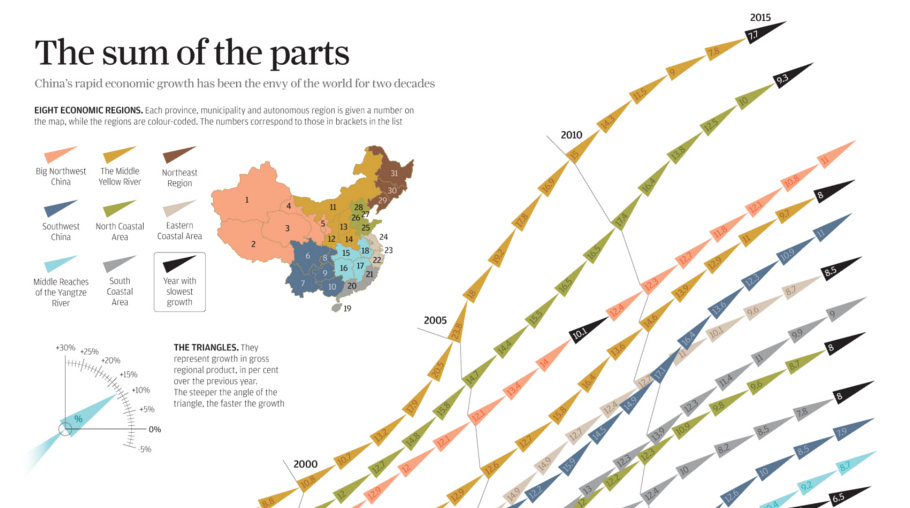
China is not much different in this regard, and today’s infographic shows the growth of individual provinces, municipalities, and other administrative areas within the country over the last 20 years.
Specific Growth Stories in China
There are several growth stories that stand out.
While many contain similar themes, each is very unique in its own right and worth studying further. Here are just some of the rapidly growing places in China that caught our eye:
Inner Mongolia
Inner Mongolia, the region of China that borders the country of Mongolia on both the south and east, is extremely rich in natural resources. Making up 12% of the country’s land mass, the region holds 25% of the world’s coal reserves and also produces rare earths, natural gas, and other commodities. Inner Mongolia has the highest installed wind power capacity in China, and the region is also the country’s largest livestock producer.
Inner Mongolia’s economy averaged just under 20% growth per year in the years from 2005-2010.
Tianjin
Tianjin is the primary industrial, commercial and economic center of North China with 15.2 million people. It’s a hub for high-tech manufacturing and logistics, producing many of the cell phone parts used throughout the world. Manufacturing makes up 47.4% of the municipality’s industrial sector, and Tianjin is one of China’s largest port cities.
Tianjin’s economy continued to accelerate from 2000 (10.8% growth) all the way to 2012 (16.4% growth) before starting to decline. The city is still growing faster than the rest of China, registering 9.3% growth in 2015.
Tibet
Tibet, known mainly as a center of Buddhism and the home of the currently exiled Dalai Lama, is a rapidly changing place. Despite a rich pastoral and nomadic tradition, Tibet is becoming more urban and diversified in terms of industry.
Tibet’s GDP, which was only 327 million yuan in 1965, has soared to 92.08 billion yuan ($14.5 billion) in 2014. This is a 281-fold increase.
Chongqing
In 2014, heavy industry made up 74% of Chongqing’s gross industrial output. The sprawling megacity and surrounding area has 32 million people, and sits at the end of the mighty Yangtze River. Chongqing produces much of the country’s automobiles, military equipment, steel, and aluminum.
Despite the national economy slowing to a 25-year low of 6.9% growth in 2015, Chongqing racked up 11% growth in the year.
Original graphic by: SCMP


Markets
Mapped: Europe’s GDP Per Capita, by Country
Which European economies are richest on a GDP per capita basis? This map shows the results for 44 countries across the continent.


Mapped: Europe’s GDP Per Capita, by Country (2024)
This was originally posted on our Voronoi app. Download the app for free on iOS or Android and discover incredible data-driven charts from a variety of trusted sources.
Europe is home to some of the largest and most sophisticated economies in the world. But how do countries in the region compare with each other on a per capita productivity basis?
In this map, we show Europe’s GDP per capita levels across 44 nations in current U.S. dollars. Data for this visualization and article is sourced from the International Monetary Fund (IMF) via their DataMapper tool, updated April 2024.
Europe’s Richest and Poorest Nations, By GDP Per Capita
Luxembourg, Ireland, and Switzerland, lead the list of Europe’s richest nations by GDP per capita, all above $100,000.
| Rank | Country | GDP Per Capita (2024) |
|---|---|---|
| 1 | 🇱🇺 Luxembourg | $131,380 |
| 2 | 🇮🇪 Ireland | $106,060 |
| 3 | 🇨🇭 Switzerland | $105,670 |
| 4 | 🇳🇴 Norway | $94,660 |
| 5 | 🇮🇸 Iceland | $84,590 |
| 6 | 🇩🇰 Denmark | $68,900 |
| 7 | 🇳🇱 Netherlands | $63,750 |
| 8 | 🇸🇲 San Marino | $59,410 |
| 9 | 🇦🇹 Austria | $59,230 |
| 10 | 🇸🇪 Sweden | $58,530 |
| 11 | 🇧🇪 Belgium | $55,540 |
| 12 | 🇫🇮 Finland | $55,130 |
| 13 | 🇩🇪 Germany | $54,290 |
| 14 | 🇬🇧 UK | $51,070 |
| 15 | 🇫🇷 France | $47,360 |
| 16 | 🇦🇩 Andorra | $44,900 |
| 17 | 🇲🇹 Malta | $41,740 |
| 18 | 🇮🇹 Italy | $39,580 |
| 19 | 🇨🇾 Cyprus | $37,150 |
| 20 | 🇪🇸 Spain | $34,050 |
| 21 | 🇸🇮 Slovenia | $34,030 |
| 22 | 🇪🇪 Estonia | $31,850 |
| 23 | 🇨🇿 Czech Republic | $29,800 |
| 24 | 🇵🇹 Portugal | $28,970 |
| 25 | 🇱🇹 Lithuania | $28,410 |
| 26 | 🇸🇰 Slovakia | $25,930 |
| 27 | 🇱🇻 Latvia | $24,190 |
| 28 | 🇬🇷 Greece | $23,970 |
| 29 | 🇭🇺 Hungary | $23,320 |
| 30 | 🇵🇱 Poland | $23,010 |
| 31 | 🇭🇷 Croatia | $22,970 |
| 32 | 🇷🇴 Romania | $19,530 |
| 33 | 🇧🇬 Bulgaria | $16,940 |
| 34 | 🇷🇺 Russia | $14,390 |
| 35 | 🇹🇷 Türkiye | $12,760 |
| 36 | 🇲🇪 Montenegro | $12,650 |
| 37 | 🇷🇸 Serbia | $12,380 |
| 38 | 🇦🇱 Albania | $8,920 |
| 39 | 🇧🇦 Bosnia & Herzegovina | $8,420 |
| 40 | 🇲🇰 North Macedonia | $7,690 |
| 41 | 🇧🇾 Belarus | $7,560 |
| 42 | 🇲🇩 Moldova | $7,490 |
| 43 | 🇽🇰 Kosovo | $6,390 |
| 44 | 🇺🇦 Ukraine | $5,660 |
| N/A | 🇪🇺 EU Average | $44,200 |
Note: Figures are rounded.
Three Nordic countries (Norway, Iceland, Denmark) also place highly, between $70,000-90,000. Other Nordic peers, Sweden and Finland rank just outside the top 10, between $55,000-60,000.
Meanwhile, Europe’s biggest economies in absolute terms, Germany, UK, and France, rank closer to the middle of the top 20, with GDP per capitas around $50,000.
Finally, at the end of the scale, Eastern Europe as a whole tends to have much lower per capita GDPs. In that group, Ukraine ranks last, at $5,660.
A Closer Look at Ukraine
For a broader comparison, Ukraine’s per capita GDP is similar to Iran ($5,310), El Salvador ($5,540), and Guatemala ($5,680).
According to experts, Ukraine’s economy has historically underperformed to expectations. After the fall of the Berlin Wall, the economy contracted for five straight years. Its transition to a Western, liberalized economic structure was overshadowed by widespread corruption, a limited taxpool, and few revenue sources.
Politically, its transformation from authoritarian regime to civil democracy has proved difficult, especially when it comes to institution building.
Finally, after the 2022 invasion of the country, Ukraine’s GDP contracted by 30% in a single year—the largest loss since independence. Large scale emigration—to the tune of six million refugees—is also playing a role.
Despite these challenges, the country’s economic growth has somewhat stabilized while fighting continues.

-

 Markets6 days ago
Visualized: Interest Rate Forecasts for Advanced Economies
-

 Markets2 weeks ago
Economic Growth Forecasts for G7 and BRICS Countries in 2024
-

 Wealth2 weeks ago
Charted: Which City Has the Most Billionaires in 2024?
-

 Technology2 weeks ago
All of the Grants Given by the U.S. CHIPS Act
-

 Green2 weeks ago
The Carbon Footprint of Major Travel Methods
-

 United States1 week ago
Visualizing the Most Common Pets in the U.S.
-

 Culture1 week ago
The World’s Top Media Franchises by All-Time Revenue
-

 Best of1 week ago
Best Visualizations of April on the Voronoi App