Energy
Visualizing China’s Dominance in Battery Manufacturing (2022-2027P)
![]() Subscribe to the Elements free mailing list for more like this
Subscribe to the Elements free mailing list for more like this
Visualizing China’s Dominance in Battery Manufacturing
This was originally posted on Elements. Sign up to the free mailing list to get beautiful visualizations on natural resource megatrends in your email every week.
With the world gearing up for the electric vehicle era, battery manufacturing has become a priority for many nations, including the United States.
However, having entered the race for batteries early, China is far and away in the lead.
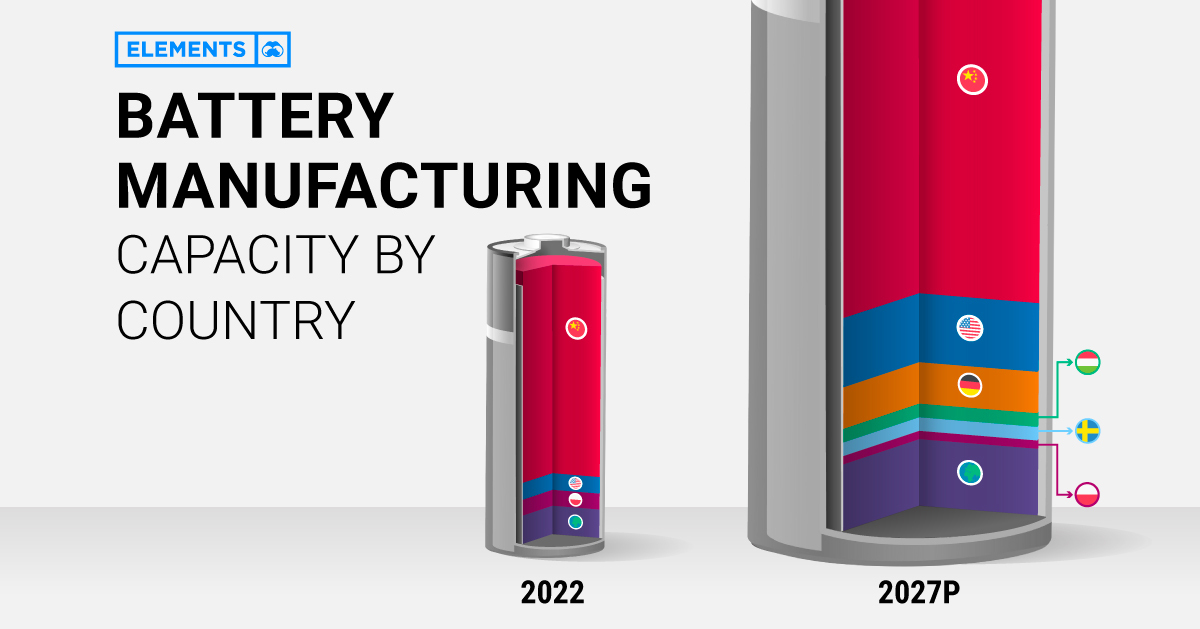
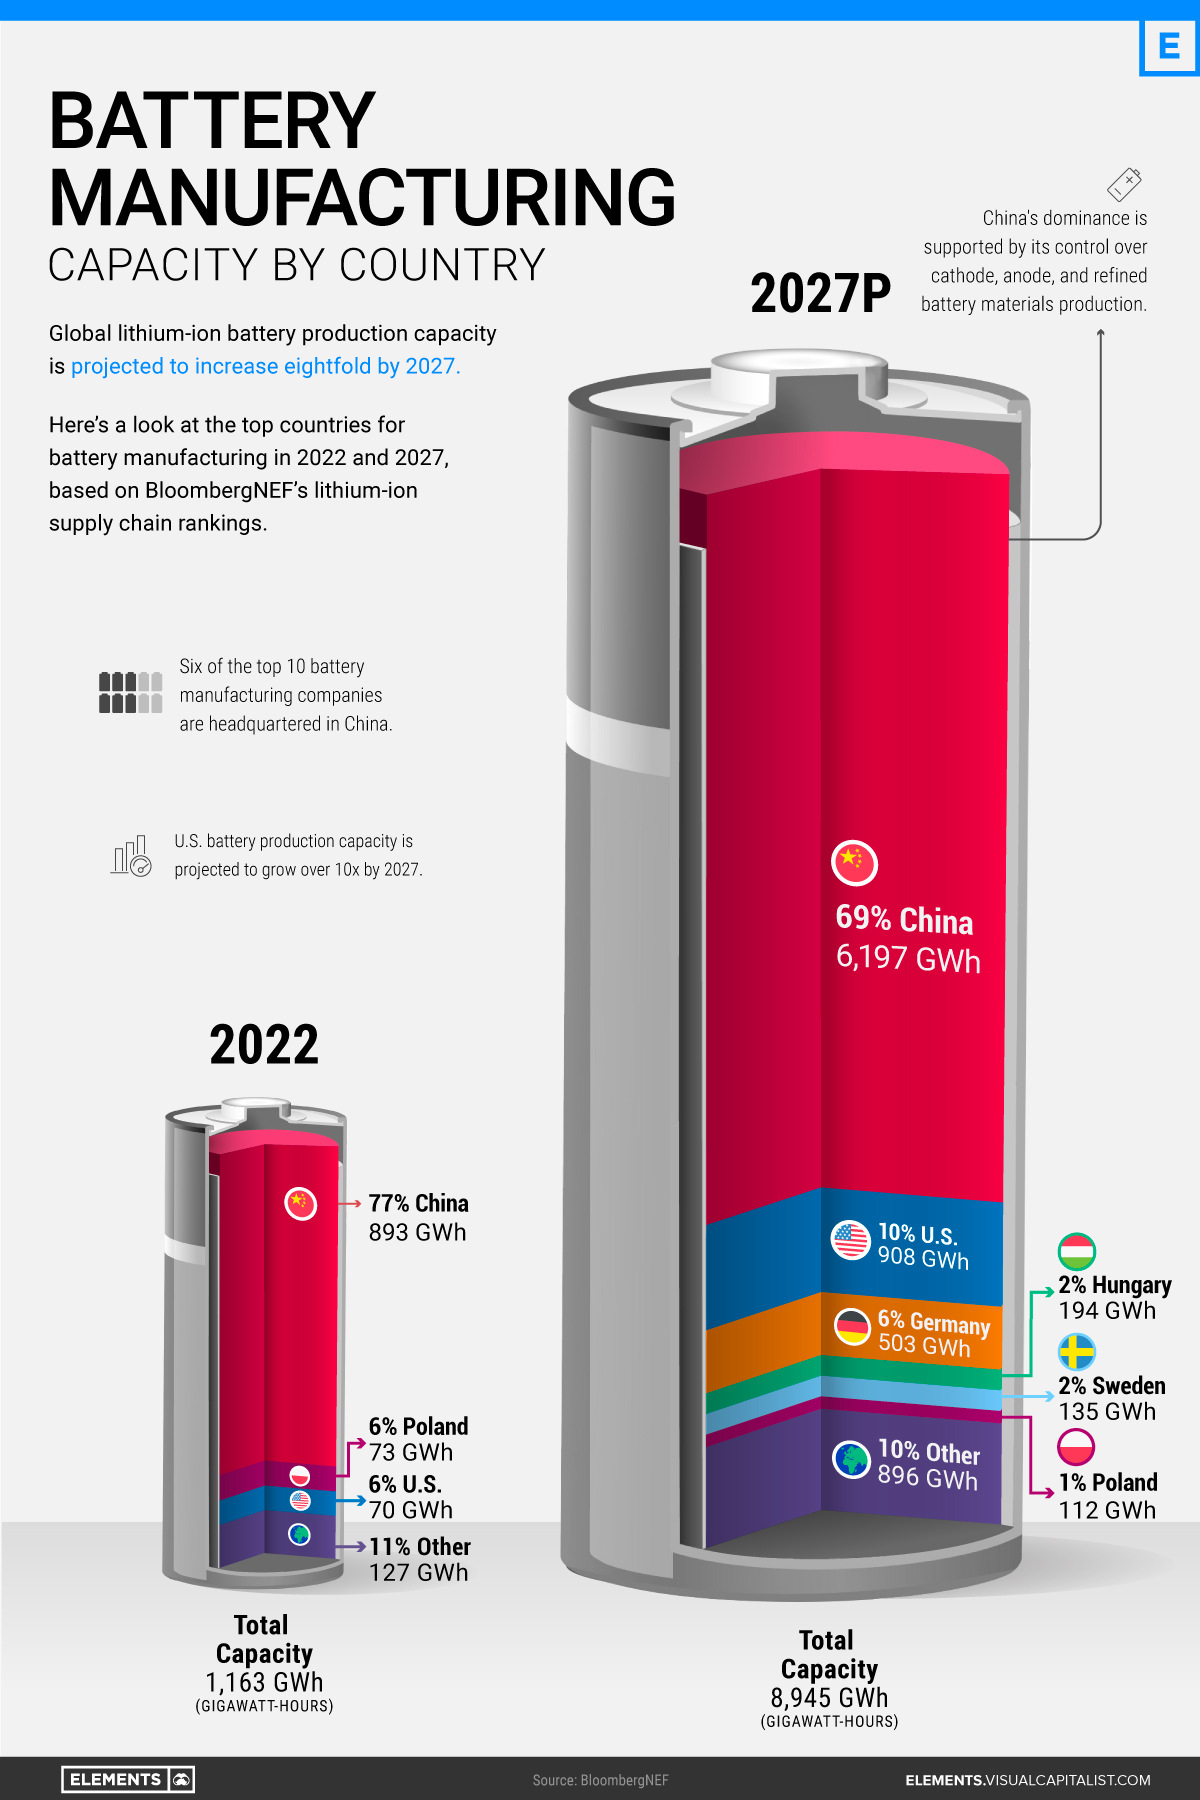
Using the data and projections behind BloombergNEF’s lithium-ion supply chain rankings, this infographic visualizes battery manufacturing capacity by country in 2022 and 2027p, highlighting the extent of China’s battery dominance.
Battery Manufacturing Capacity by Country in 2022
In 2022, China had more battery production capacity than the rest of the world combined.
| Rank | Country | 2022 Battery Cell Manufacturing Capacity, GWh | % of Total |
|---|---|---|---|
| #1 | 🇨🇳 China | 893 | 77% |
| #2 | 🇵🇱 Poland | 73 | 6% |
| #3 | 🇺🇸 U.S. | 70 | 6% |
| #4 | 🇭🇺 Hungary | 38 | 3% |
| #5 | 🇩🇪 Germany | 31 | 3% |
| #6 | 🇸🇪 Sweden | 16 | 1% |
| #7 | 🇰🇷 South Korea | 15 | 1% |
| #8 | 🇯🇵 Japan | 12 | 1% |
| #9 | 🇫🇷 France | 6 | 1% |
| #10 | 🇮🇳 India | 3 | 0.2% |
| 🌍 Other | 7 | 1% | |
| Total | 1,163 | 100% |
With nearly 900 gigawatt-hours of manufacturing capacity or 77% of the global total, China is home to six of the world’s 10 biggest battery makers. Behind China’s battery dominance is its vertical integration across the rest of the EV supply chain, from mining the metals to producing the EVs. It’s also the largest EV market, accounting for 52% of global sales in 2021.
Poland ranks second with less than one-tenth of China’s capacity. In addition, it hosts LG Energy Solution’s Wroclaw gigafactory, the largest of its kind in Europe and one of the largest in the world. Overall, European countries (including non-EU members) made up just 14% of global battery manufacturing capacity in 2022.
Although it lives in China’s shadow when it comes to batteries, the U.S. is also among the world’s lithium-ion powerhouses. As of 2022, it had eight major operational battery factories, concentrated in the Midwest and the South.
China’s Near-Monopoly Continues Through 2027
Global lithium-ion manufacturing capacity is projected to increase eightfold in the next five years. Here are the top 10 countries by projected battery production capacity in 2027:
| Rank | Country | 2027P Battery Cell Manufacturing Capacity, GWh | % of Total |
|---|---|---|---|
| #1 | 🇨🇳 China | 6,197 | 69% |
| #2 | 🇺🇸 U.S. | 908 | 10% |
| #3 | 🇩🇪 Germany | 503 | 6% |
| #4 | 🇭🇺 Hungary | 194 | 2% |
| #5 | 🇸🇪 Sweden | 135 | 2% |
| #6 | 🇵🇱 Poland | 112 | 1% |
| #7 | 🇨🇦 Canada | 106 | 1% |
| #8 | 🇪🇸 Spain | 98 | 1% |
| #9 | 🇫🇷 France | 89 | 1% |
| #10 | 🇲🇽 Mexico | 80 | 1% |
| 🌍 Other | 523 | 6% | |
| Total | 8,945 | 100% |
China’s well-established advantage is set to continue through 2027, with 69% of the world’s battery manufacturing capacity.
Meanwhile, the U.S. is projected to increase its capacity by more than 10-fold in the next five years. EV tax credits in the Inflation Reduction Act are likely to incentivize battery manufacturing by rewarding EVs made with domestic materials. Alongside Ford and General Motors, Asian companies including Toyota, SK Innovation, and LG Energy Solution have all announced investments in U.S. battery manufacturing in recent months.
Europe will host six of the projected top 10 countries for battery production in 2027. Europe’s current and future battery plants come from a mix of domestic and foreign firms, including Germany’s Volkswagen, China’s CATL, and South Korea’s SK Innovation.
Can Countries Cut Ties With China?
Regardless of the growth in North America and Europe, China’s dominance is unmatched.
Battery manufacturing is just one piece of the puzzle, albeit a major one. Most of the parts and metals that make up a battery—like battery-grade lithium, electrolytes, separators, cathodes, and anodes—are primarily made in China.
Therefore, combating China’s dominance will be expensive. According to Bloomberg, the U.S. and Europe will have to invest $87 billion and $102 billion, respectively, to meet domestic battery demand with fully local supply chains by 2030.
Who’s Building the Most Solar Energy?
This was originally posted on our Voronoi app. Download the app for free on iOS or Android and discover incredible data-driven charts from a variety of trusted sources.
In 2023, solar energy accounted for three-quarters of renewable capacity additions worldwide. Most of this growth occurred in Asia, the EU, and the U.S., continuing a trend observed over the past decade.
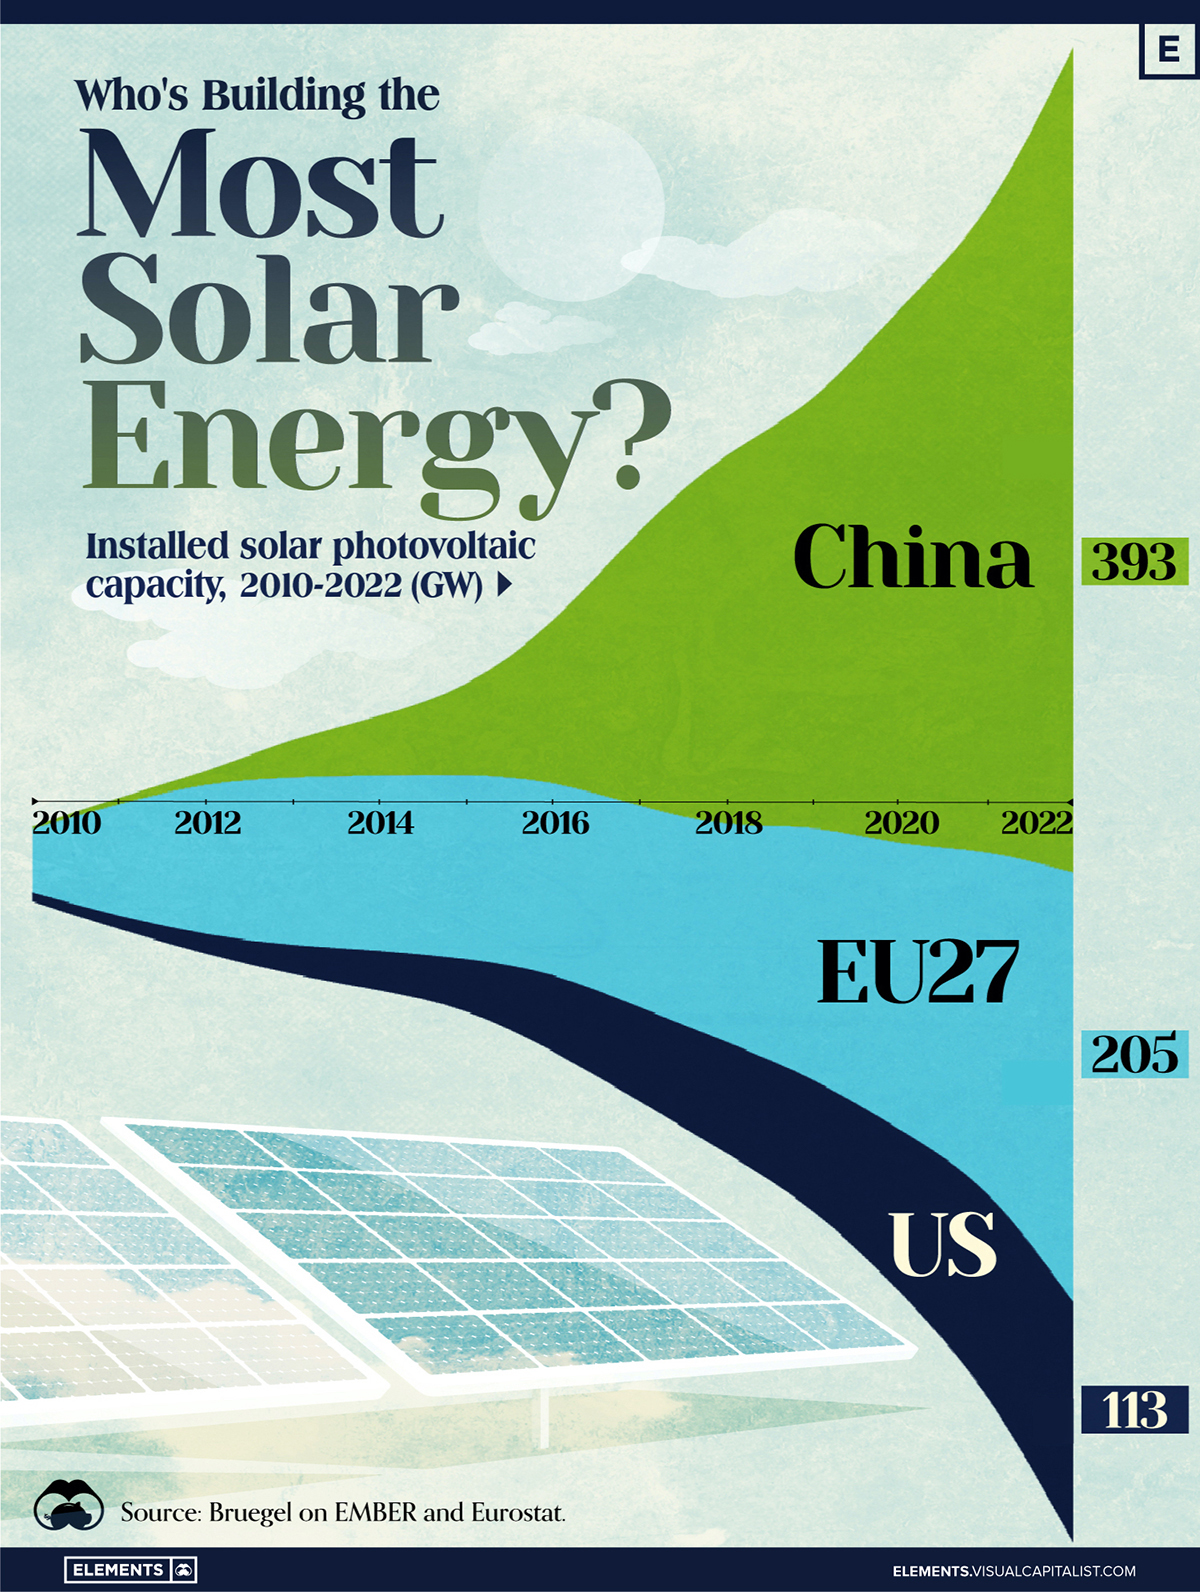
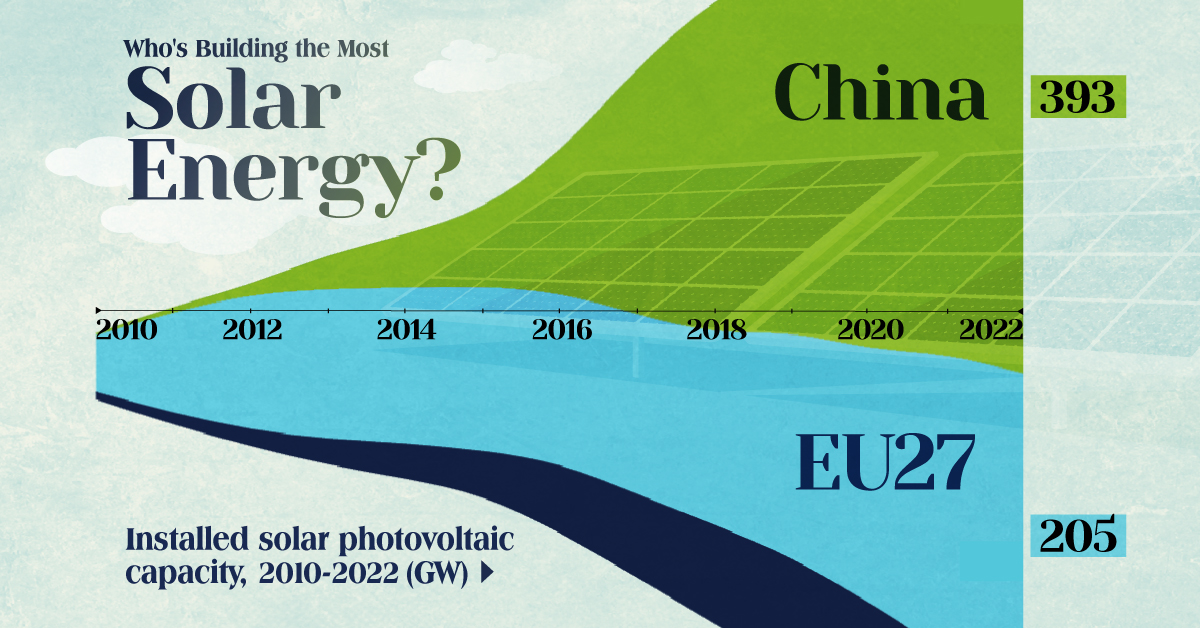
In this graphic, we illustrate the rise in installed solar photovoltaic (PV) capacity in China, the EU, and the U.S. between 2010 and 2022, measured in gigawatts (GW). Bruegel compiled the data..
Chinese Dominance
As of 2022, China’s total installed capacity stands at 393 GW, nearly double that of the EU’s 205 GW and surpassing the USA’s total of 113 GW by more than threefold in absolute terms.
| Installed solar capacity (GW) | China | EU27 | U.S. |
|---|---|---|---|
| 2022 | 393.0 | 205.5 | 113.0 |
| 2021 | 307.0 | 162.7 | 95.4 |
| 2020 | 254.0 | 136.9 | 76.4 |
| 2019 | 205.0 | 120.1 | 61.6 |
| 2018 | 175.3 | 104.0 | 52.0 |
| 2017 | 130.8 | 96.2 | 43.8 |
| 2016 | 77.8 | 91.5 | 35.4 |
| 2015 | 43.6 | 87.7 | 24.2 |
| 2014 | 28.4 | 83.6 | 18.1 |
| 2013 | 17.8 | 79.7 | 13.3 |
| 2012 | 6.7 | 71.1 | 8.6 |
| 2011 | 3.1 | 53.3 | 5.6 |
| 2010 | 1.0 | 30.6 | 3.4 |
Since 2017, China has shown a compound annual growth rate (CAGR) of approximately 25% in installed PV capacity, while the USA has seen a CAGR of 21%, and the EU of 16%.
Additionally, China dominates the production of solar power components, currently controlling around 80% of the world’s solar panel supply chain.
In 2022, China’s solar industry employed 2.76 million individuals, with manufacturing roles representing approximately 1.8 million and the remaining 918,000 jobs in construction, installation, and operations and maintenance.
The EU industry employed 648,000 individuals, while the U.S. reached 264,000 jobs.
According to the IEA, China accounts for almost 60% of new renewable capacity expected to become operational globally by 2028.
Despite the phasing out of national subsidies in 2020 and 2021, deployment of solar PV in China is accelerating. The country is expected to reach its national 2030 target for wind and solar PV installations in 2024, six years ahead of schedule.
-

 Markets5 days ago
Visualizing Global Inflation Forecasts (2024-2026)
-

 Green2 weeks ago
The Carbon Footprint of Major Travel Methods
-

 United States2 weeks ago
Visualizing the Most Common Pets in the U.S.
-

 Culture2 weeks ago
The World’s Top Media Franchises by All-Time Revenue
-

 voronoi1 week ago
Best Visualizations of April on the Voronoi App
-

 Wealth1 week ago
Charted: Which Country Has the Most Billionaires in 2024?
-

 Business1 week ago
The Top Private Equity Firms by Country
-

 Markets1 week ago
The Best U.S. Companies to Work for According to LinkedIn

