Markets
How China Overtook the U.S. as the World’s Major Trading Partner
How China Overtook the U.S. As the World’s Trade Partner
In 2018, trade accounted for 59% of global GDP, up nearly 1.5 times since 1980.
Over this timeframe, international trade has transformed significantly—not just in terms of volume and composition, but also in terms of the countries that the rest of the world leans on for their most important trade relationships.
Now, a critical shift is occurring in the landscape, and it may surprise you to learn that China has already usurped the U.S. as the world’s most dominant trading partner.
Trading Places: A Global Shift
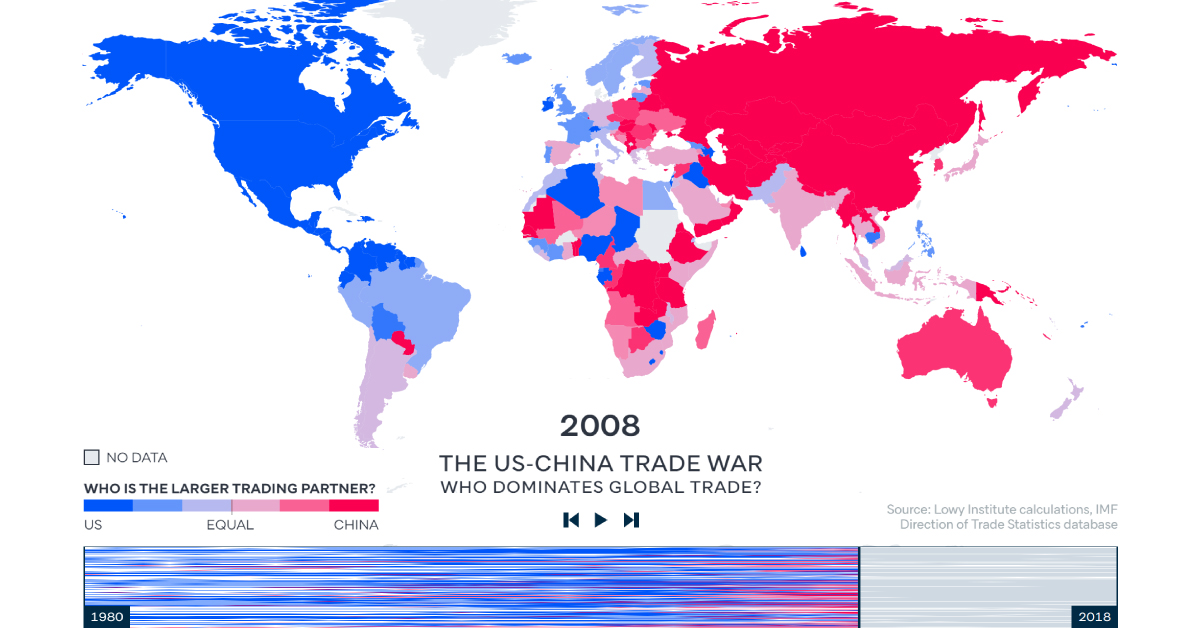
Today’s animation comes from the Lowy Institute, and it pulls data from the International Monetary Fund (IMF) database on bilateral trade flows, to determine whether the U.S. or China is a bigger trading partner for each country from 1980 to 2018.
The results are stark: before 2000, the U.S. was at the helm of global trade, as over 80% of countries traded with the U.S. more than they did with China. By 2018, that number had dropped sharply to just 30%, as China swiftly took top position in 128 of 190 countries.
The researchers pinpoint China’s 2001 entry into the World Trade Organization as a major turning point in China’s international trade relationships. The dramatic shift that followed is clearly demonstrated in the visualization above—between 2005 and 2010, a number of countries tipped towards Chinese influence, especially in Africa and Asia.
Over time, China’s dominance has grown dramatically. It’s no wonder then, that China and the U.S. have a contentious trade relationship themselves, as both nations battle it out for first place.
A Tale of Two Economies
The United States and China are competitors in many ways, but to be successful they must rely on each other for mutually beneficial trade. However, it’s also the major issue on which they are struggling to reach a common ground.
The U.S. has been vocal about negotiating more balanced trade agreements with China. In fact, a mid-2018 poll shows that 62% of Americans consider their trade relationship with China to be unfair.
Since 2018, both parties have faced a fraught relationship, imposing major tariffs on consumer and industrial goods—and retaliations are reaching greater and greater heights:
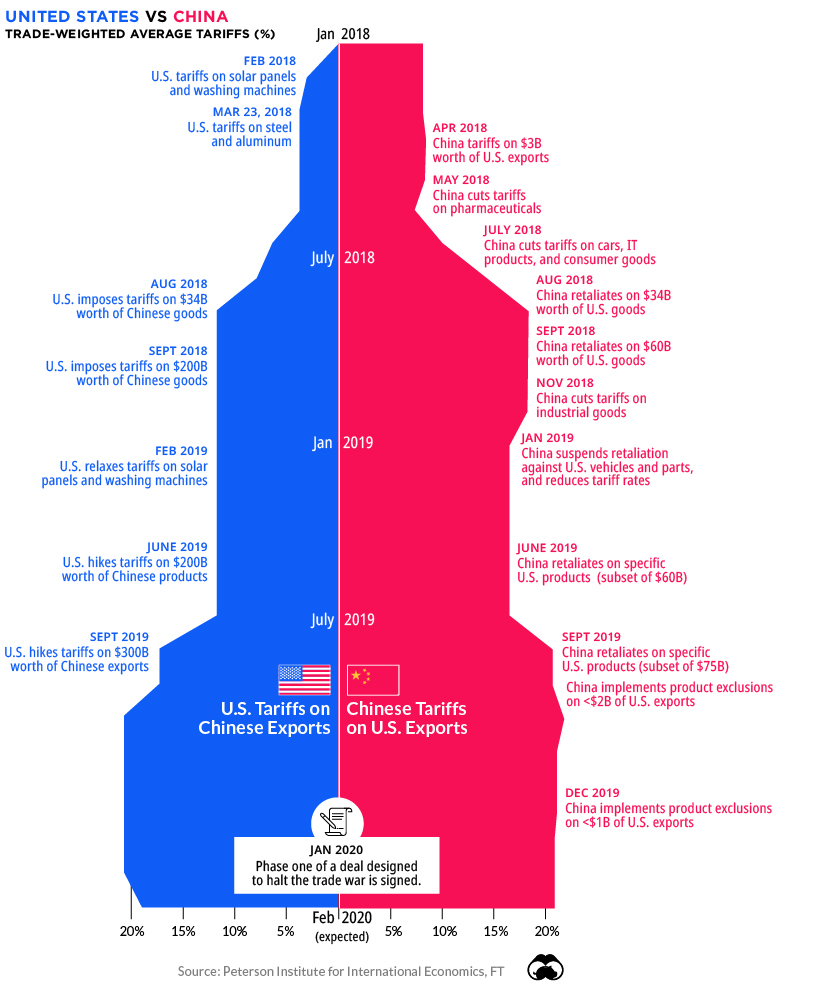
While a delicate truce has been reached at the moment, the trade war has caused a significant drag on global growth, and the World Bank estimates it will continue to have an effect into 2021.
At the same time, China’s sphere of influence continues to grow.
One Belt, One Road, One Trade Direction?
China seems to have a finger in every pie. The nation is financing a flurry of megaprojects across Asia and Africa—but one broader initiative stands above the rest.
China’s “One Belt, One Road” (OBOR) Initiative, planned for a 2049 completion, is advancing at a furious pace. In 2019 alone, Chinese companies signed contracts worth up to $128 billion to start Chinese large-scale infrastructure projects in various countries.
While building new highways and ports abroad is beneficial for Chinese financiers, OBOR is also about creating new markets and trade routes for Chinese goods in Asia. Recent research found that the OBOR program’s infrastructure expansion and logistics performance improvements led to positive effects on China’s exports.
Nevertheless, it’s clear the new infrastructure network is already transforming global trade, possibly cementing China’s position as the world’s major trading partner for years to come.


Markets
Mapped: Europe’s GDP Per Capita, by Country
Which European economies are richest on a GDP per capita basis? This map shows the results for 44 countries across the continent.


Mapped: Europe’s GDP Per Capita, by Country (2024)
This was originally posted on our Voronoi app. Download the app for free on iOS or Android and discover incredible data-driven charts from a variety of trusted sources.
Europe is home to some of the largest and most sophisticated economies in the world. But how do countries in the region compare with each other on a per capita productivity basis?
In this map, we show Europe’s GDP per capita levels across 44 nations in current U.S. dollars. Data for this visualization and article is sourced from the International Monetary Fund (IMF) via their DataMapper tool, updated April 2024.
Europe’s Richest and Poorest Nations, By GDP Per Capita
Luxembourg, Ireland, and Switzerland, lead the list of Europe’s richest nations by GDP per capita, all above $100,000.
| Rank | Country | GDP Per Capita (2024) |
|---|---|---|
| 1 | 🇱🇺 Luxembourg | $131,380 |
| 2 | 🇮🇪 Ireland | $106,060 |
| 3 | 🇨🇭 Switzerland | $105,670 |
| 4 | 🇳🇴 Norway | $94,660 |
| 5 | 🇮🇸 Iceland | $84,590 |
| 6 | 🇩🇰 Denmark | $68,900 |
| 7 | 🇳🇱 Netherlands | $63,750 |
| 8 | 🇸🇲 San Marino | $59,410 |
| 9 | 🇦🇹 Austria | $59,230 |
| 10 | 🇸🇪 Sweden | $58,530 |
| 11 | 🇧🇪 Belgium | $55,540 |
| 12 | 🇫🇮 Finland | $55,130 |
| 13 | 🇩🇪 Germany | $54,290 |
| 14 | 🇬🇧 UK | $51,070 |
| 15 | 🇫🇷 France | $47,360 |
| 16 | 🇦🇩 Andorra | $44,900 |
| 17 | 🇲🇹 Malta | $41,740 |
| 18 | 🇮🇹 Italy | $39,580 |
| 19 | 🇨🇾 Cyprus | $37,150 |
| 20 | 🇪🇸 Spain | $34,050 |
| 21 | 🇸🇮 Slovenia | $34,030 |
| 22 | 🇪🇪 Estonia | $31,850 |
| 23 | 🇨🇿 Czech Republic | $29,800 |
| 24 | 🇵🇹 Portugal | $28,970 |
| 25 | 🇱🇹 Lithuania | $28,410 |
| 26 | 🇸🇰 Slovakia | $25,930 |
| 27 | 🇱🇻 Latvia | $24,190 |
| 28 | 🇬🇷 Greece | $23,970 |
| 29 | 🇭🇺 Hungary | $23,320 |
| 30 | 🇵🇱 Poland | $23,010 |
| 31 | 🇭🇷 Croatia | $22,970 |
| 32 | 🇷🇴 Romania | $19,530 |
| 33 | 🇧🇬 Bulgaria | $16,940 |
| 34 | 🇷🇺 Russia | $14,390 |
| 35 | 🇹🇷 Türkiye | $12,760 |
| 36 | 🇲🇪 Montenegro | $12,650 |
| 37 | 🇷🇸 Serbia | $12,380 |
| 38 | 🇦🇱 Albania | $8,920 |
| 39 | 🇧🇦 Bosnia & Herzegovina | $8,420 |
| 40 | 🇲🇰 North Macedonia | $7,690 |
| 41 | 🇧🇾 Belarus | $7,560 |
| 42 | 🇲🇩 Moldova | $7,490 |
| 43 | 🇽🇰 Kosovo | $6,390 |
| 44 | 🇺🇦 Ukraine | $5,660 |
| N/A | 🇪🇺 EU Average | $44,200 |
Note: Figures are rounded.
Three Nordic countries (Norway, Iceland, Denmark) also place highly, between $70,000-90,000. Other Nordic peers, Sweden and Finland rank just outside the top 10, between $55,000-60,000.
Meanwhile, Europe’s biggest economies in absolute terms, Germany, UK, and France, rank closer to the middle of the top 20, with GDP per capitas around $50,000.
Finally, at the end of the scale, Eastern Europe as a whole tends to have much lower per capita GDPs. In that group, Ukraine ranks last, at $5,660.
A Closer Look at Ukraine
For a broader comparison, Ukraine’s per capita GDP is similar to Iran ($5,310), El Salvador ($5,540), and Guatemala ($5,680).
According to experts, Ukraine’s economy has historically underperformed to expectations. After the fall of the Berlin Wall, the economy contracted for five straight years. Its transition to a Western, liberalized economic structure was overshadowed by widespread corruption, a limited taxpool, and few revenue sources.
Politically, its transformation from authoritarian regime to civil democracy has proved difficult, especially when it comes to institution building.
Finally, after the 2022 invasion of the country, Ukraine’s GDP contracted by 30% in a single year—the largest loss since independence. Large scale emigration—to the tune of six million refugees—is also playing a role.
Despite these challenges, the country’s economic growth has somewhat stabilized while fighting continues.

-

 Technology5 days ago
Mapped: The Number of AI Startups By Country
-

 Jobs2 weeks ago
The Best U.S. Companies to Work for According to LinkedIn
-

 Economy2 weeks ago
Ranked: The Top 20 Countries in Debt to China
-

 United States2 weeks ago
Charted: Trust in Government Institutions by G7 Countries
-

 Energy2 weeks ago
Mapped: The Age of Energy Projects in Interconnection Queues, by State
-

 Mining2 weeks ago
Visualizing Global Gold Production in 2023
-

 Markets1 week ago
Visualized: Interest Rate Forecasts for Advanced Economies
-

 Economy1 week ago
The Most Valuable Companies in Major EU Economies