Markets
Does America View Its Trade Relationships as Fair?
Does America View Its Trade Relationships as Fair?
The Chart of the Week is a weekly Visual Capitalist feature on Fridays.
Understandably, most people are not experts on the subject of trade.
But while the average person won’t likely be able to guess the U.S. trade deficit with Mexico, perceptions of trade relationships in the public eye are still a crucial indicator.
If the majority of Americans think they are getting the short end of the stick on international trade, this sentiment ultimately affects how politicians campaign, how policy decisions are made, and the success of the wider economy.
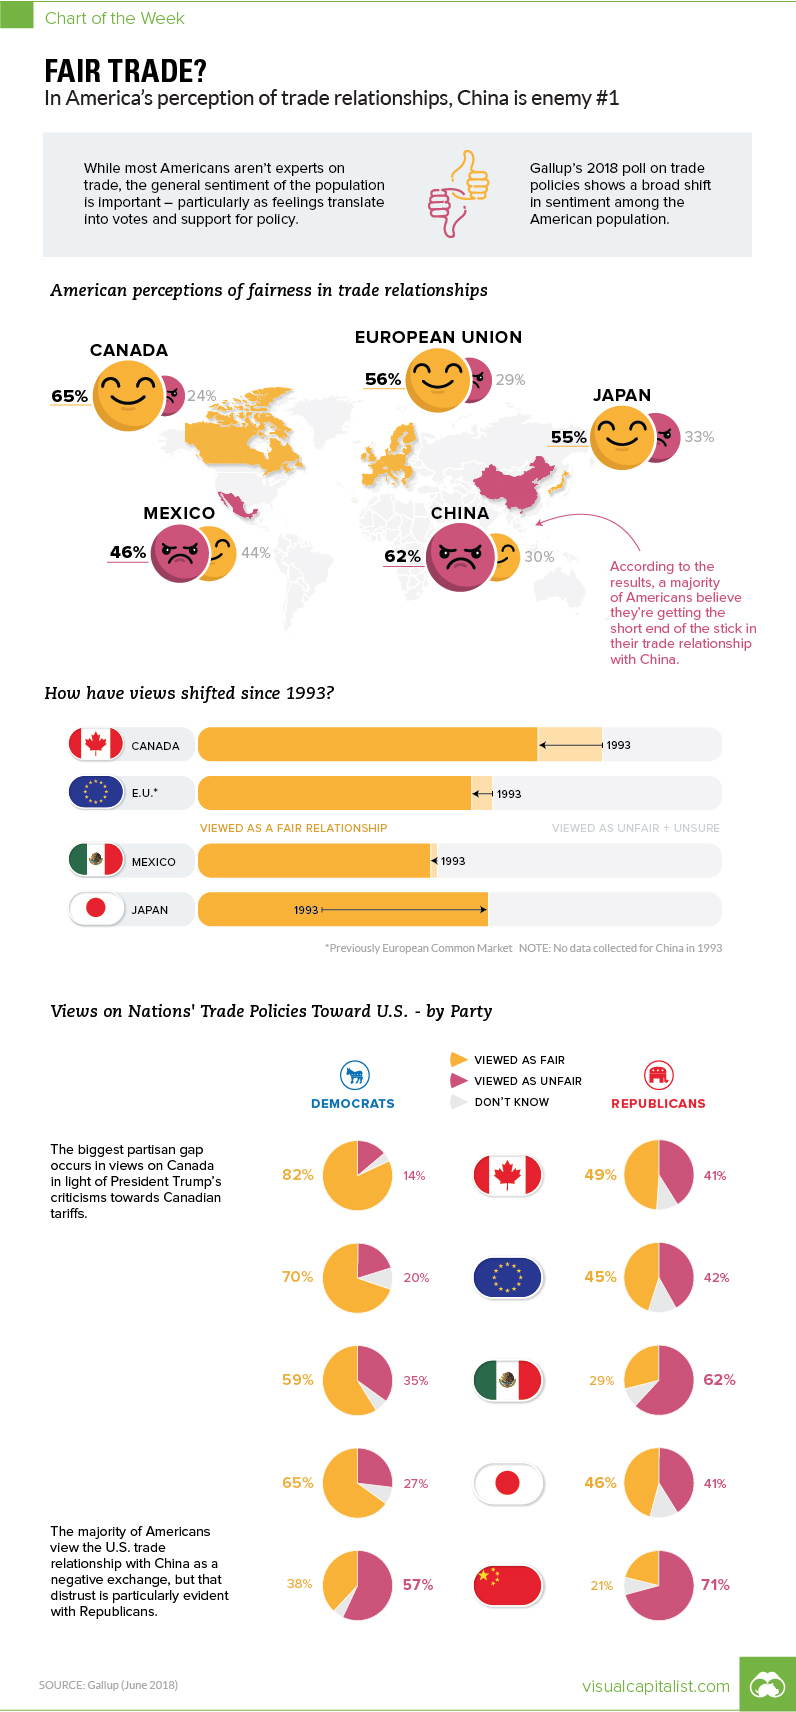
U.S. Perceptions of Trade
In today’s chart, we break down the data from a recent Gallup poll on how Americans view the country’s trade relationships.
At a high level, here is how it looks by country:
| U.S. Trade Partner | Fair | Unfair | Don't know / No opinion |
|---|---|---|---|
| Canada | 65% | 24% | 10% |
| European Union | 56% | 29% | 15% |
| Japan | 55% | 33% | 12% |
| Mexico | 44% | 46% | 11% |
| China | 30% | 62% | 9% |
Source: Gallup, June 18-24, 2018
The majority of Americans think relationships with Canada (65%), the European Union (56%), and Japan (55%) are fair. When it comes to Mexico, respondents are split (44% fair, 46% unfair).
Meanwhile, it’s clear that most Americans think they are getting the short end of the stick with China, with 62% of respondents describing the relationship as unfair.
The China Problem
China is America’s largest trading partner, so this negative sentiment has meaningful implications.
The balance of trade that the U.S. has with China is also crystal clear: in 2017, the two countries traded $636 billion of goods, but the vast majority of this number comes from Chinese imports into the United States:
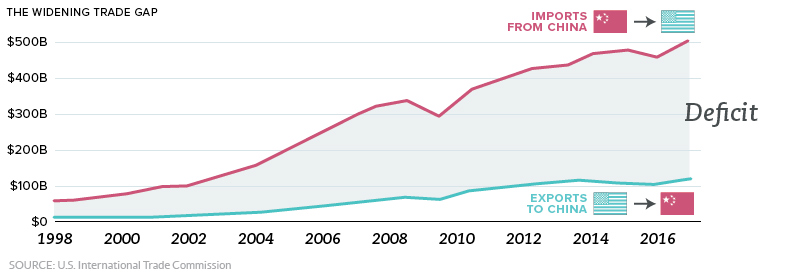
Most economists actually think that trade deficits are less important than they appear, but this trade gap is also visceral for many people. After all, U.S. exports barely make a dent in the mix, and this sends a message that America is “losing”.
Between the above trade deficit, intellectual property issues, and jobs going overseas, it’s understandable why the perception of Chinese-U.S. trade is under fire in terms of public sentiment.
And with the start of the recent trade war, the view on China could sour even further.
The Partisan Perspective
Interestingly, Democrats and Republicans have very different views on U.S. relationships, including the one with China:
| U.S. Trade Partner | Fair (Democrats) | Fair (Republicans) |
|---|---|---|
| Canada | 82% | 49% |
| European Union | 70% | 42% |
| Japan | 65% | 46% |
| Mexico | 59% | 29% |
| China | 38% | 21% |
Source: Gallup, June 18-24, 2018
Comparing Republicans and Democrats, three different relationships have opinion gaps of about 30%: Canada, European Union, and Mexico. In all cases, Democrats favored the relationships far more than Republicans.
That said, when it comes to China and Japan, the parties are slightly more aligned.
Only a minority in both parties thought the U.S. trade relationship with China was fair, with 21% of Republicans and 38% of Democrats in agreement.


Economy
Economic Growth Forecasts for G7 and BRICS Countries in 2024
The IMF has released its economic growth forecasts for 2024. How do the G7 and BRICS countries compare?


G7 & BRICS Real GDP Growth Forecasts for 2024
The International Monetary Fund’s (IMF) has released its real gross domestic product (GDP) growth forecasts for 2024, and while global growth is projected to stay steady at 3.2%, various major nations are seeing declining forecasts.
This chart visualizes the 2024 real GDP growth forecasts using data from the IMF’s 2024 World Economic Outlook for G7 and BRICS member nations along with Saudi Arabia, which is still considering an invitation to join the bloc.
Get the Key Insights of the IMF’s World Economic Outlook
Want a visual breakdown of the insights from the IMF’s 2024 World Economic Outlook report?
This visual is part of a special dispatch of the key takeaways exclusively for VC+ members.
Get the full dispatch of charts by signing up to VC+.
Mixed Economic Growth Prospects for Major Nations in 2024
Economic growth projections by the IMF for major nations are mixed, with the majority of G7 and BRICS countries forecasted to have slower growth in 2024 compared to 2023.
Only three BRICS-invited or member countries, Saudi Arabia, the UAE, and South Africa, have higher projected real GDP growth rates in 2024 than last year.
| Group | Country | Real GDP Growth (2023) | Real GDP Growth (2024P) |
|---|---|---|---|
| G7 | 🇺🇸 U.S. | 2.5% | 2.7% |
| G7 | 🇨🇦 Canada | 1.1% | 1.2% |
| G7 | 🇯🇵 Japan | 1.9% | 0.9% |
| G7 | 🇫🇷 France | 0.9% | 0.7% |
| G7 | 🇮🇹 Italy | 0.9% | 0.7% |
| G7 | 🇬🇧 UK | 0.1% | 0.5% |
| G7 | 🇩🇪 Germany | -0.3% | 0.2% |
| BRICS | 🇮🇳 India | 7.8% | 6.8% |
| BRICS | 🇨🇳 China | 5.2% | 4.6% |
| BRICS | 🇦🇪 UAE | 3.4% | 3.5% |
| BRICS | 🇮🇷 Iran | 4.7% | 3.3% |
| BRICS | 🇷🇺 Russia | 3.6% | 3.2% |
| BRICS | 🇪🇬 Egypt | 3.8% | 3.0% |
| BRICS-invited | 🇸🇦 Saudi Arabia | -0.8% | 2.6% |
| BRICS | 🇧🇷 Brazil | 2.9% | 2.2% |
| BRICS | 🇿🇦 South Africa | 0.6% | 0.9% |
| BRICS | 🇪🇹 Ethiopia | 7.2% | 6.2% |
| 🌍 World | 3.2% | 3.2% |
China and India are forecasted to maintain relatively high growth rates in 2024 at 4.6% and 6.8% respectively, but compared to the previous year, China is growing 0.6 percentage points slower while India is an entire percentage point slower.
On the other hand, four G7 nations are set to grow faster than last year, which includes Germany making its comeback from its negative real GDP growth of -0.3% in 2023.
Faster Growth for BRICS than G7 Nations
Despite mostly lower growth forecasts in 2024 compared to 2023, BRICS nations still have a significantly higher average growth forecast at 3.6% compared to the G7 average of 1%.
While the G7 countries’ combined GDP is around $15 trillion greater than the BRICS nations, with continued higher growth rates and the potential to add more members, BRICS looks likely to overtake the G7 in economic size within two decades.
BRICS Expansion Stutters Before October 2024 Summit
BRICS’ recent expansion has stuttered slightly, as Argentina’s newly-elected president Javier Milei declined its invitation and Saudi Arabia clarified that the country is still considering its invitation and has not joined BRICS yet.
Even with these initial growing pains, South Africa’s Foreign Minister Naledi Pandor told reporters in February that 34 different countries have submitted applications to join the growing BRICS bloc.
Any changes to the group are likely to be announced leading up to or at the 2024 BRICS summit which takes place October 22-24 in Kazan, Russia.
Get the Full Analysis of the IMF’s Outlook on VC+
This visual is part of an exclusive special dispatch for VC+ members which breaks down the key takeaways from the IMF’s 2024 World Economic Outlook.
For the full set of charts and analysis, sign up for VC+.

-

 Markets1 week ago
U.S. Debt Interest Payments Reach $1 Trillion
-

 Markets2 weeks ago
Ranked: The Most Valuable Housing Markets in America
-

 Money2 weeks ago
Which States Have the Highest Minimum Wage in America?
-

 AI2 weeks ago
Ranked: Semiconductor Companies by Industry Revenue Share
-

 Markets2 weeks ago
Ranked: The World’s Top Flight Routes, by Revenue
-

 Countries2 weeks ago
Population Projections: The World’s 6 Largest Countries in 2075
-

 Markets2 weeks ago
The Top 10 States by Real GDP Growth in 2023
-

 Money2 weeks ago
The Smallest Gender Wage Gaps in OECD Countries