Markets
Charted: Tesla’s Global Sales By Model and Year (2016–2023)
![]() See this visualization first on the Voronoi app.
See this visualization first on the Voronoi app.
Charted: Tesla’s Global Sales By Model and Year (2016–2023)
This was originally posted on our Voronoi app. Download the app for free on Apple or Android and discover incredible data-driven charts from a variety of trusted sources.
In the last five years, Tesla stock has exploded upwards more than 800%.
From a company that was perpetually on the verge of bankruptcy, Tesla has emerged as the EV manufacturer to beat in the automotive market.
A huge part of the success comes from Tesla’s sales which jumped 30x in the same time period.
We take a look at the numbers, as well as the sales share between the different Tesla models from 2016-2023 using data from CleanTechnica, an archive for news and data around clean technology.
Tesla’s Global Sales Sales Through the Years
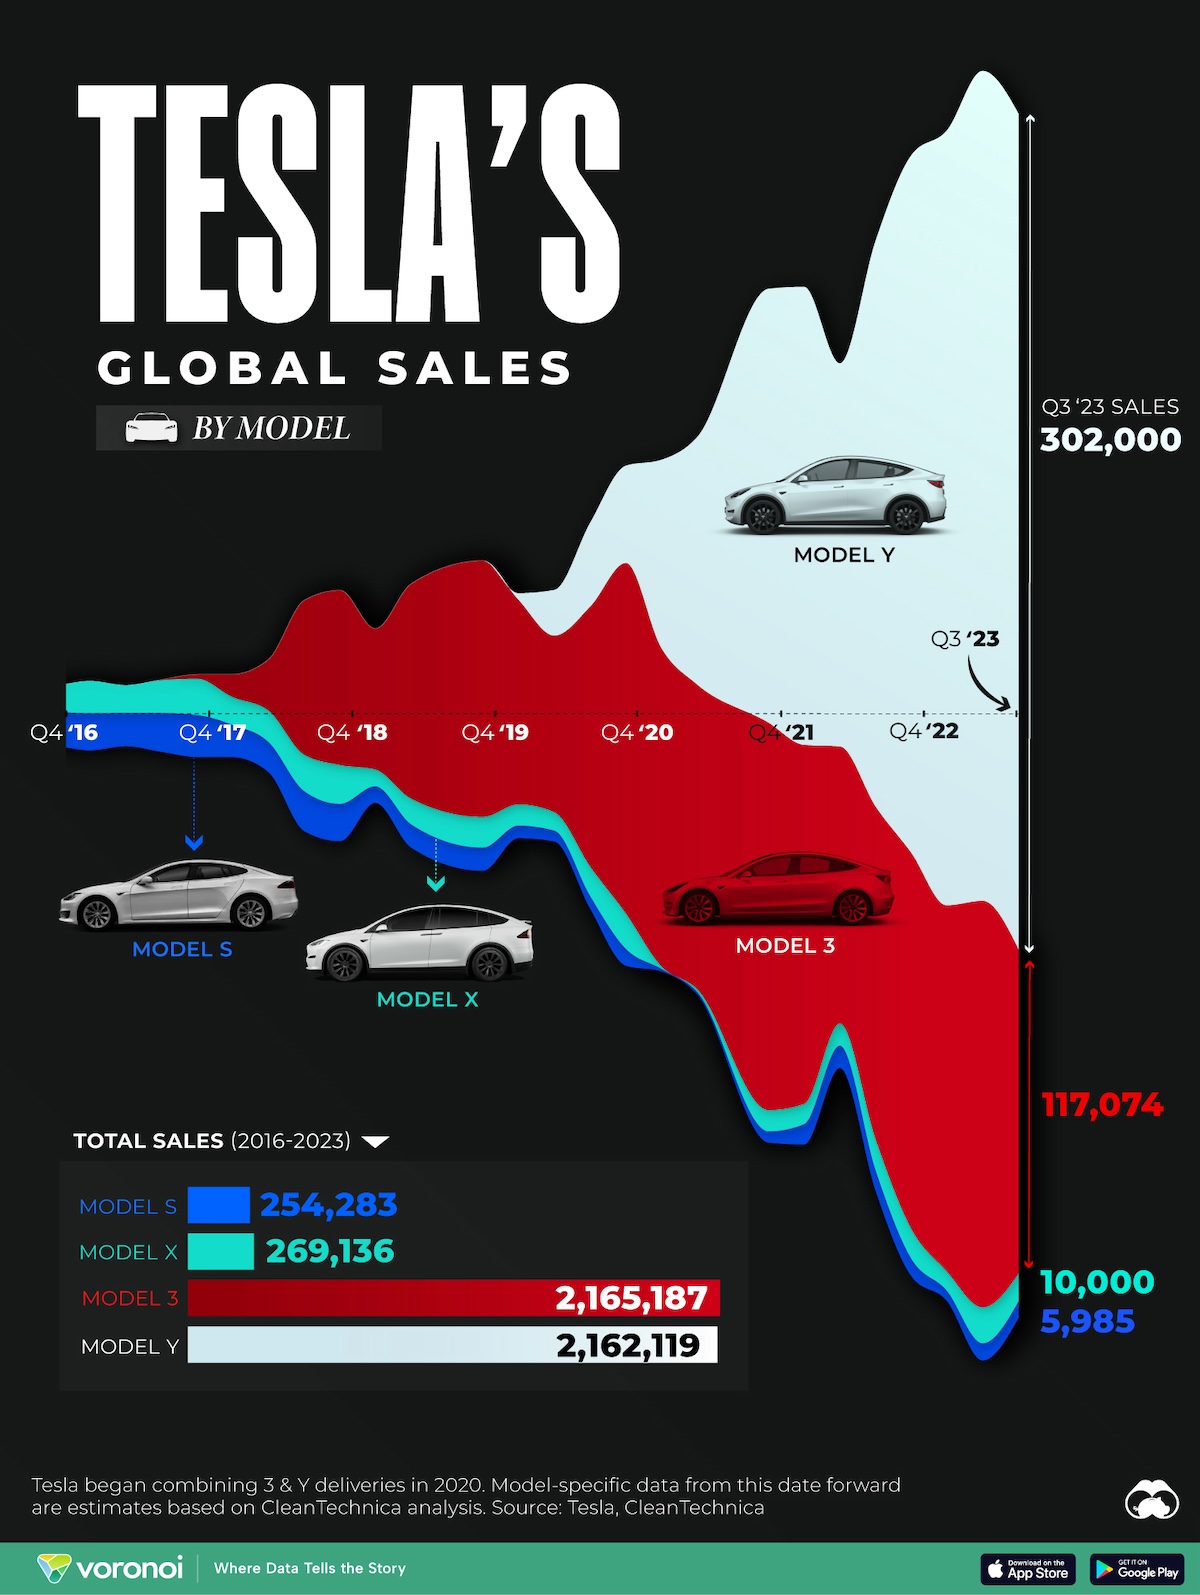
From 2018 onwards, Tesla’s global sales began to skyrocket. Though quarter-on-quarter growth wasn’t always positive, dips were followed by more breakout numbers.
Here’s the model breakdown of Tesla’s global sales, from Q2 2016 to Q3 2023.
| Date | Tesla Model S | Tesla Model X | Tesla Model 3 | Tesla Model Y |
|---|---|---|---|---|
| Q2 2016 | 9,764 | 4,638 | N/A | N/A |
| Q3 2016 | 16,047 | 8,774 | N/A | N/A |
| Q4 2016 | 12,700 | 9,500 | N/A | N/A |
| Q1 2017 | 13,481 | 11,570 | N/A | N/A |
| Q2 2017 | 12,010 | 10,010 | N/A | N/A |
| Q3 2017 | 14,065 | 11,865 | 220 | N/A |
| Q4 2017 | 15,200 | 13,120 | 1,550 | N/A |
| Q1 2018 | 11,730 | 10,070 | 8,180 | N/A |
| Q2 2018 | 10,930 | 11,370 | 18,440 | N/A |
| Q3 2018 | 14,470 | 13,190 | 55,840 | N/A |
| Q4 2018 | 13,500 | 14,050 | 63,150 | N/A |
| Q1 2019 | 6,000 | 6,100 | 50,900 | N/A |
| Q2 2019 | 8,422 | 9,300 | 77,634 | N/A |
| Q3 2019 | 8,383 | 9,100 | 79,703 | N/A |
| Q4 2019 | 8,375 | 11,100 | 92,620 | N/A |
| Q1 2020 | 4,525 | 7,705 | 73,975 | 2,291 |
| Q2 2020 | 3,927 | 6,687 | 63,793 | 16,484 |
| Q3 2020 | 4,583 | 10,693 | 94,049 | 30,269 |
| Q4 2020 | 6,060 | 12,860 | 126,624 | 35,123 |
| Q1 2021 | 1,010 | 1,010 | 115,077 | 67,780 |
| Q2 2021 | 890 | 1,000 | 110,054 | 89,360 |
| Q3 2021 | 9,000 | 275 | 111,225 | 120,800 |
| Q4 2021 | 4,050 | 7,700 | 140,000 | 156,850 |
| Q1 2022 | 7,362 | 7,362 | 129,764 | 165,560 |
| Q2 2022 | 8,081 | 8,081 | 100,066 | 138,467 |
| Q3 2022 | 7,469 | 11,203 | 120,308 | 204,850 |
| Q4 2022 | 6,344 | 10,803 | 135,846 | 252,285 |
| Q1 2023 | 3,695 | 7,000 | 132,180 | 280,000 |
| Q2 2023 | 6,225 | 13,000 | 146,915 | 300,000 |
| Q3 2023 | 5,985 | 10,000 | 117,074 | 302,000 |
| Total | 254,283 | 269,136 | 2,165,187 | 2,162,119 |
Note: Beginning in 2020, Tesla’s reporting began to combine Model 3 & Y sales together. Model-specific data from this point is based on CleanTechnica’s estimates.
Aside from this steep rise, another key factor to note is how Tesla’s lineup has changed. The company began ramping production with the Model S and X, two luxury models that helped the brand build a prestigious image.
However since 2020 , the company has successfully transitioned to cheaper high volume models like the Model 3 and Y.
In fact, 2020 was also the first year Tesla turned a profit thanks in part to the Model Y.
The Model 3 and Y were also the world’s best-selling EVs in 2023.
Tesla’s presumed rival, Amazon and Ford-backed Rivian, is planning a similar approach. Its first models include the relatively expensive, full-size R1T and R1S. However the company has hinted at a 2024 reveal for its cheaper R2 model, with production starting in 2026.


Markets
Mapped: Europe’s GDP Per Capita, by Country
Which European economies are richest on a GDP per capita basis? This map shows the results for 44 countries across the continent.


Mapped: Europe’s GDP Per Capita, by Country (2024)
This was originally posted on our Voronoi app. Download the app for free on iOS or Android and discover incredible data-driven charts from a variety of trusted sources.
Europe is home to some of the largest and most sophisticated economies in the world. But how do countries in the region compare with each other on a per capita productivity basis?
In this map, we show Europe’s GDP per capita levels across 44 nations in current U.S. dollars. Data for this visualization and article is sourced from the International Monetary Fund (IMF) via their DataMapper tool, updated April 2024.
Europe’s Richest and Poorest Nations, By GDP Per Capita
Luxembourg, Ireland, and Switzerland, lead the list of Europe’s richest nations by GDP per capita, all above $100,000.
| Rank | Country | GDP Per Capita (2024) |
|---|---|---|
| 1 | 🇱🇺 Luxembourg | $131,380 |
| 2 | 🇮🇪 Ireland | $106,060 |
| 3 | 🇨🇭 Switzerland | $105,670 |
| 4 | 🇳🇴 Norway | $94,660 |
| 5 | 🇮🇸 Iceland | $84,590 |
| 6 | 🇩🇰 Denmark | $68,900 |
| 7 | 🇳🇱 Netherlands | $63,750 |
| 8 | 🇸🇲 San Marino | $59,410 |
| 9 | 🇦🇹 Austria | $59,230 |
| 10 | 🇸🇪 Sweden | $58,530 |
| 11 | 🇧🇪 Belgium | $55,540 |
| 12 | 🇫🇮 Finland | $55,130 |
| 13 | 🇩🇪 Germany | $54,290 |
| 14 | 🇬🇧 UK | $51,070 |
| 15 | 🇫🇷 France | $47,360 |
| 16 | 🇦🇩 Andorra | $44,900 |
| 17 | 🇲🇹 Malta | $41,740 |
| 18 | 🇮🇹 Italy | $39,580 |
| 19 | 🇨🇾 Cyprus | $37,150 |
| 20 | 🇪🇸 Spain | $34,050 |
| 21 | 🇸🇮 Slovenia | $34,030 |
| 22 | 🇪🇪 Estonia | $31,850 |
| 23 | 🇨🇿 Czech Republic | $29,800 |
| 24 | 🇵🇹 Portugal | $28,970 |
| 25 | 🇱🇹 Lithuania | $28,410 |
| 26 | 🇸🇰 Slovakia | $25,930 |
| 27 | 🇱🇻 Latvia | $24,190 |
| 28 | 🇬🇷 Greece | $23,970 |
| 29 | 🇭🇺 Hungary | $23,320 |
| 30 | 🇵🇱 Poland | $23,010 |
| 31 | 🇭🇷 Croatia | $22,970 |
| 32 | 🇷🇴 Romania | $19,530 |
| 33 | 🇧🇬 Bulgaria | $16,940 |
| 34 | 🇷🇺 Russia | $14,390 |
| 35 | 🇹🇷 Türkiye | $12,760 |
| 36 | 🇲🇪 Montenegro | $12,650 |
| 37 | 🇷🇸 Serbia | $12,380 |
| 38 | 🇦🇱 Albania | $8,920 |
| 39 | 🇧🇦 Bosnia & Herzegovina | $8,420 |
| 40 | 🇲🇰 North Macedonia | $7,690 |
| 41 | 🇧🇾 Belarus | $7,560 |
| 42 | 🇲🇩 Moldova | $7,490 |
| 43 | 🇽🇰 Kosovo | $6,390 |
| 44 | 🇺🇦 Ukraine | $5,660 |
| N/A | 🇪🇺 EU Average | $44,200 |
Note: Figures are rounded.
Three Nordic countries (Norway, Iceland, Denmark) also place highly, between $70,000-90,000. Other Nordic peers, Sweden and Finland rank just outside the top 10, between $55,000-60,000.
Meanwhile, Europe’s biggest economies in absolute terms, Germany, UK, and France, rank closer to the middle of the top 20, with GDP per capitas around $50,000.
Finally, at the end of the scale, Eastern Europe as a whole tends to have much lower per capita GDPs. In that group, Ukraine ranks last, at $5,660.
A Closer Look at Ukraine
For a broader comparison, Ukraine’s per capita GDP is similar to Iran ($5,310), El Salvador ($5,540), and Guatemala ($5,680).
According to experts, Ukraine’s economy has historically underperformed to expectations. After the fall of the Berlin Wall, the economy contracted for five straight years. Its transition to a Western, liberalized economic structure was overshadowed by widespread corruption, a limited taxpool, and few revenue sources.
Politically, its transformation from authoritarian regime to civil democracy has proved difficult, especially when it comes to institution building.
Finally, after the 2022 invasion of the country, Ukraine’s GDP contracted by 30% in a single year—the largest loss since independence. Large scale emigration—to the tune of six million refugees—is also playing a role.
Despite these challenges, the country’s economic growth has somewhat stabilized while fighting continues.

-

 Healthcare5 days ago
Life Expectancy by Region (1950-2050F)
-

 Economy2 weeks ago
Ranked: The Top 20 Countries in Debt to China
-

 Politics2 weeks ago
Charted: Trust in Government Institutions by G7 Countries
-

 Energy2 weeks ago
Mapped: The Age of Energy Projects in Interconnection Queues, by State
-

 Mining2 weeks ago
Visualizing Global Gold Production in 2023
-

 Markets1 week ago
Visualized: Interest Rate Forecasts for Advanced Economies
-

 Economy1 week ago
The Most Valuable Companies in Major EU Economies
-

 Markets1 week ago
The World’s Fastest Growing Emerging Markets (2024-2029 Forecast)