Maps
Interactive Map: The World as 1,000 People
Hover or click on countries to see how many people each would have. If you’re having troubled loading the map, click here to see a static version.
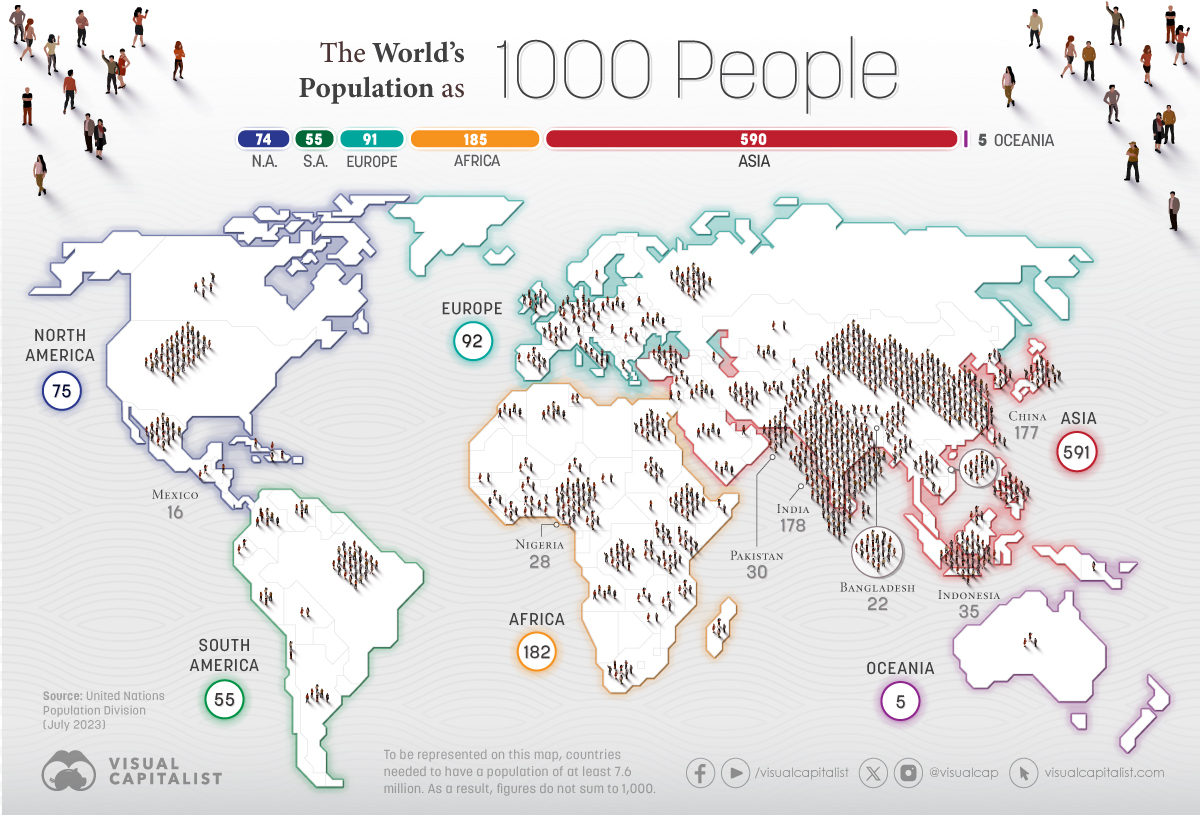
All The People in the World as 1,000 People
The world’s population has doubled in size over the last 50 years.
In 2022, we reached the mark of 8 billion living on Earth. According to UN estimates, by July 2023, all the people in the world numbered 8,045,311,447.
In this interactive map, we use population estimates from the United Nations Population Division to illustrate the world’s population as if the Earth had only 1,000 people. Countries with a population of below 7.6 million did not make our cutoff to be visualized, but are included in overall calculations and listed below.
Over Half of People Live in Asia
Asia is by far the world’s most populous region, with over 4.7 billion people. The continent, led by India and China, represents 59% of the total population.
Imagining the Earth with only 1,000 people helps illustrate this more easily. India would account for 178 people and China would have 177.
Here is the estimated population in July 2023 for each country, and how many people their residents would constitute out of 1,000:
| Country | Total Population (July 2023) | Share of 1,000 Global People |
|---|---|---|
| 🇮🇳 India | 1,428,627,663 | 178 |
| 🇨🇳 China | 1,425,671,352 | 177 |
| 🇺🇸 United States | 339,996,563 | 42 |
| 🇮🇩 Indonesia | 277,534,122 | 35 |
| 🇵🇰 Pakistan | 240,485,658 | 30 |
| 🇳🇬 Nigeria | 223,804,632 | 28 |
| 🇧🇷 Brazil | 216,422,446 | 27 |
| 🇧🇩 Bangladesh | 172,954,319 | 22 |
| 🇷🇺 Russia | 144,444,359 | 18 |
| 🇲🇽 Mexico | 128,455,567 | 16 |
| 🇪🇹 Ethiopia | 126,527,060 | 16 |
| 🇯🇵 Japan | 123,294,513 | 15 |
| 🇵🇭 Philippines | 117,337,368 | 15 |
| 🇪🇬 Egypt | 112,716,598 | 14 |
| 🇨🇩 DRC | 102,262,808 | 13 |
| 🇻🇳 Vietnam | 98,858,950 | 12 |
| 🇮🇷 Iran | 89,172,767 | 11 |
| 🇹🇷 Türkiye | 85,816,199 | 11 |
| 🇩🇪 Germany | 83,294,633 | 10 |
| 🇹🇭 Thailand | 71,801,279 | 9 |
| 🇬🇧 United Kingdom | 67,736,802 | 8 |
| 🇹🇿 Tanzania | 67,438,106 | 8 |
| 🇫🇷 France | 64,756,584 | 8 |
| 🇿🇦 South Africa | 60,414,495 | 8 |
| 🇮🇹 Italy | 58,870,762 | 7 |
| 🇰🇪 Kenya | 55,100,586 | 7 |
| 🇲🇲 Myanmar | 54,577,997 | 7 |
| 🇨🇴 Colombia | 52,085,168 | 7 |
| 🇰🇷 South Korea | 51,784,059 | 6 |
| 🇺🇬 Uganda | 48,582,334 | 6 |
| 🇸🇩 Sudan | 48,109,006 | 6 |
| 🇪🇸 Spain | 47,519,628 | 6 |
| 🇦🇷 Argentina | 45,773,884 | 6 |
| 🇩🇿 Algeria | 45,606,480 | 6 |
| 🇮🇶 Iraq | 45,504,560 | 6 |
| 🇦🇫 Afghanistan | 42,239,854 | 5 |
| 🇵🇱 Poland | 41,026,067 | 5 |
| 🇨🇦 Canada | 38,781,291 | 5 |
| 🇲🇦 Morocco | 37,840,044 | 5 |
| 🇸🇦 Saudi Arabia | 36,947,025 | 5 |
| 🇺🇦 Ukraine | 36,744,634 | 5 |
| 🇦🇴 Angola | 36,684,202 | 5 |
| 🇺🇿 Uzbekistan | 35,163,944 | 4 |
| 🇾🇪 Yemen | 34,449,825 | 4 |
| 🇵🇪 Peru | 34,352,719 | 4 |
| 🇲🇾 Malaysia | 34,308,525 | 4 |
| 🇬🇭 Ghana | 34,121,985 | 4 |
| 🇲🇿 Mozambique | 33,897,354 | 4 |
| 🇳🇵 Nepal | 30,896,590 | 4 |
| 🇲🇬 Madagascar | 30,325,732 | 4 |
| 🇨🇮 Côte d'Ivoire | 28,873,034 | 4 |
| 🇻🇪 Venezuela | 28,838,499 | 4 |
| 🇨🇲 Cameroon | 28,647,293 | 4 |
| 🇳🇪 Niger | 27,202,843 | 3 |
| 🇦🇺 Australia | 26,439,111 | 3 |
| 🇰🇵 North Korea | 26,160,821 | 3 |
| 🇹🇼 Taiwan | 23,923,276 | 3 |
| 🇲🇱 Mali | 23,293,698 | 3 |
| 🇧🇫 Burkina Faso | 23,251,485 | 3 |
| 🇸🇾 Syria | 23,227,014 | 3 |
| 🇱🇰 Sri Lanka | 21,893,579 | 3 |
| 🇲🇼 Malawi | 20,931,751 | 3 |
| 🇿🇲 Zambia | 20,569,737 | 3 |
| 🇷🇴 Romania | 19,892,812 | 3 |
| 🇨🇱 Chile | 19,629,590 | 2 |
| 🇰🇿 Kazakhstan | 19,606,633 | 2 |
| 🇹🇩 Chad | 18,278,568 | 2 |
| 🇪🇨 Ecuador | 18,190,484 | 2 |
| 🇸🇴 Somalia | 18,143,378 | 2 |
| 🇬🇹 Guatemala | 18,092,026 | 2 |
| 🇸🇳 Senegal | 17,763,163 | 2 |
| 🇳🇱 Netherlands | 17,618,299 | 2 |
| 🇰🇭 Cambodia | 16,944,826 | 2 |
| 🇿🇼 Zimbabwe | 16,665,409 | 2 |
| 🇬🇳 Guinea | 14,190,612 | 2 |
| 🇷🇼 Rwanda | 14,094,683 | 2 |
| 🇧🇯 Benin | 13,712,828 | 2 |
| 🇧🇮 Burundi | 13,238,559 | 2 |
| 🇹🇳 Tunisia | 12,458,223 | 2 |
| 🇧🇴 Bolivia | 12,388,571 | 2 |
| 🇭🇹 Haiti | 11,724,763 | 2 |
| 🇧🇪 Belgium | 11,686,140 | 2 |
| 🇯🇴 Jordan | 11,337,052 | 1 |
| 🇩🇴 Dominican Republic | 11,332,972 | 1 |
| 🇨🇺 Cuba | 11,194,449 | 1 |
| 🇸🇸 South Sudan | 11,088,796 | 1 |
| 🇸🇪 Sweden | 10,612,086 | 1 |
| 🇭🇳 Honduras | 10,593,798 | 1 |
| 🇨🇿 Czech Republic (Czechia) | 10,495,295 | 1 |
| 🇦🇿 Azerbaijan | 10,412,651 | 1 |
| 🇬🇷 Greece | 10,341,277 | 1 |
| 🇵🇬 Papua New Guinea | 10,329,931 | 1 |
| 🇵🇹 Portugal | 10,247,605 | 1 |
| 🇭🇺 Hungary | 10,156,239 | 1 |
| 🇹🇯 Tajikistan | 10,143,543 | 1 |
| 🇦🇪 United Arab Emirates | 9,516,871 | 1 |
| 🇧🇾 Belarus | 9,498,238 | 1 |
| 🇮🇱 Israel | 9,174,520 | 1 |
| 🇹🇬 Togo | 9,053,799 | 1 |
| 🇦🇹 Austria | 8,958,960 | 1 |
| 🇨🇭 Switzerland | 8,796,669 | 1 |
| 🇸🇱 Sierra Leone | 8,791,092 | 1 |
| 🇱🇦 Laos | 7,633,779 | 0.9 |
| 🇭🇰 Hong Kong | 7,491,609 | 0.9 |
| 🇷🇸 Serbia | 7,149,077 | 0.9 |
| 🇳🇮 Nicaragua | 7,046,310 | 0.9 |
| 🇱🇾 Libyg | 6,888,388 | 0.9 |
| 🇵🇾 Paraguay | 6,861,524 | 0.9 |
| 🇰🇬 Kyrgyzstan | 6,735,347 | 0.8 |
| 🇧🇬 ßulgaria | 6,687,717 | 0.8 |
| 🇹🇲 Turkmenistan | 6,516,100 | 0.8 |
| 🇸🇻 EI Salvador | 6,364,943 | 0.8 |
| 🇨🇬 Congo | 6,106,869 | 0.8 |
| 🇸🇬 Singapore | 6,014,723 | 0.7 |
| 🇩🇰 Denmark | 5,910,913 | 0.7 |
| 🇸🇰 Slovakia | 5,795,199 | 0.7 |
| 🇨🇫 Central African Republic | 5,742,315 | 0.7 |
| 🇫🇮 Finland | 5,545,475 | 0.7 |
| 🇳🇴 Norway | 5,474,360 | 0.7 |
| 🇱🇷 Liberia | 5,418,377 | 0.7 |
| 🇵🇸 State of Palestine | 5,371,230 | 0.7 |
| 🇱🇧 Lebanon | 5,353,930 | 0.7 |
| 🇳🇿 New Zealand | 5,228,100 | 0.6 |
| 🇨🇷 Costa Rica | 5,212,173 | 0.6 |
| 🇮🇪 Ireland | 5,056,935 | 0.6 |
| 🇲🇷 Mauritania | 4,862,989 | 0.6 |
| 🇴🇲 Oman | 4,644,384 | 0.6 |
| 🇵🇦 Panama | 4,468,087 | 0.6 |
| 🇰🇼 Kuwait | 4,310,108 | 0.5 |
| 🇭🇷 Croatia | 4,008,617 | 0.5 |
| 🇪🇷 Eritrea | 3,748,901 | 0.5 |
| 🇬🇪 Georgia | 3,728,282 | 0.5 |
| 🇲🇳 Mongolia | 3,447,157 | 0.4 |
| 🇲🇩 Moldova | 3,435,931 | 0.4 |
| 🇺🇾 Uruguay | 3,423,108 | 0.4 |
| 🇵🇷 Puerto Rico | 3,260,314 | 0.4 |
| 🇧🇦 Bosnia and Herzegovina | 3,210,847 | 0.4 |
| 🇦🇱 Albania | 2,832,439 | 0.4 |
| 🇯🇲 Jamaica | 2,825,544 | 0.4 |
| 🇦🇲 Armenia | 2,777,970 | 0.3 |
| 🇬🇲 Gambia | 2,773,168 | 0.3 |
| 🇱🇹 Lithuania | 2,718,352 | 0.3 |
| 🇶🇦 Qatar | 2,716,391 | 0.3 |
| 🇧🇼 Botswana | 2,675,352 | 0.3 |
| 🇳🇦 Namibia | 2,604,172 | 0.3 |
| 🇬🇦 Gabon | 2,436,566 | 0.3 |
| 🇱🇸 Lesotho | 2,330,318 | 0.3 |
| 🇬🇼 Guinea-Bissau | 2,150,842 | 0.3 |
| 🇸🇮 Slovenia | 2,119,675 | 0.3 |
| 🇲🇰 North Macedonia | 2,085,679 | 0.3 |
| 🇱🇻 Latvia | 1,830,211 | 0.2 |
| 🇬🇶 Equatorial Guinea | 1,714,671 | 0.2 |
| 🇽🇰 Kosovo | 1,663,594 | 0.2 |
| 🇹🇹 Trinidad and Tobago | 1,534,937 | 0.2 |
| 🇧🇭 Bahrain | 1,485,509 | 0.2 |
| 🇹🇱 Timor-Leste | 1,360,596 | 0.2 |
| 🇪🇪 Estonia | 1,322,765 | 0.2 |
| 🇲🇺 Mauritius | 1,300,557 | 0.2 |
| 🇨🇾 Cyprus | 1,260,138 | 0.2 |
| 🇸🇿 Eswatini | 1,210,822 | 0.2 |
| 🇩🇯 Djibouti | 1,136,455 | 0.1 |
| 🇷🇪 Réunion | 981,796 | 0.1 |
| 🇫🇯 Fiji | 936,375 | 0.1 |
| 🇰🇲 Comoros | 852,075 | 0.1 |
| 🇬🇾 Guyana | 813,834 | 0.1 |
| 🇧🇹 Bhutan | 787,424 | 0.1 |
| 🇸🇧 Solomon Islands | 740,424 | 0.1 |
| 🇲🇴 Macao | 704,149 | 0.1 |
| 🇱🇺 Luxembourg | 654,768 | 0.1 |
| 🇲🇪 Montenegro | 626,485 | 0.1 |
| 🇸🇷 Suriname | 623,236 | 0.1 |
| 🇨🇻 Cabo Verde | 598,682 | 0.1 |
| 🇪🇭 Western Sahara | 587,259 | 0.1 |
| 🇲🇹 Malta | 535,064 | 0.1 |
| 🇲🇻 Maldives | 521,021 | 0.1 |
| 🇧🇳 Brunei | 452,524 | 0.1 |
| 🇧🇸 Bahamas | 412,623 | 0.1 |
| 🇧🇿 Belize | 410,825 | 0.1 |
| 🇬🇵 Guadeloupe | 395,839 | 0.0 |
| 🇮🇸 Iceland | 375,318 | 0.0 |
| 🇲🇶 Martinique | 366,981 | 0.0 |
| 🇾🇹 Mayotte | 335,995 | 0.0 |
| 🇻🇺 Vanuatu | 334,506 | 0.0 |
| 🇬🇫 French Guiana | 312,155 | 0.0 |
| 🇵🇫 French Polynesia | 308,872 | 0.0 |
| 🇳🇨 New Caledonia | 292,991 | 0.0 |
| 🇧🇧 Barbados | 281,995 | 0.0 |
| 🇸🇹 Sao Tome & Principe | 231,856 | 0.0 |
| 🇼🇸 Samoa | 225,681 | 0.0 |
| 🇨🇼 Curaçao | 192,077 | 0.0 |
| 🇱🇨 Saint Lucia | 180,251 | 0.0 |
| 🇬🇺 Guam | 172,952 | 0.0 |
| 🇰🇮 Kiribati | 133,515 | 0.0 |
| 🇬🇩 Grenada | 126,183 | 0.0 |
| 🇫🇲 Micronesia (Fed. States of) | 115,224 | 0.0 |
| 🇯🇪 Jersey | 111,802 | 0.0 |
| 🇹🇴 Tonga | 107,773 | 0.0 |
| 🇸🇨 Seychelles | 107,660 | 0.0 |
| 🇦🇼 Aruba | 106,277 | 0.0 |
| 🇻🇨 St. Vincent & Grenadines | 103,698 | 0.0 |
| 🇻🇮 U.S. Virgin Islands | 98,750 | 0.0 |
| 🇦🇬 Antigua and Barbuda | 94,298 | 0.0 |
| 🇮🇲 Isle of Man | 84,710 | 0.0 |
| 🇦🇩 Andorra | 80,088 | 0.0 |
| 🇩🇲 Dominica | 73,040 | 0.0 |
| 🇰🇾 Cayman Islands | 69,310 | 0.0 |
| 🇧🇲 Bermuda | 64,069 | 0.0 |
| 🇬🇬 Guernsey | 63,544 | 0.0 |
| 🇬🇱 Greenland | 56,643 | 0.0 |
| 🇫🇴 Faeroe Islands | 53,270 | 0.0 |
| 🇲🇵 Northern Mariana Islands | 49,796 | 0.0 |
| 🇰🇳 Saint Kitts & Nevis | 47,755 | 0.0 |
| 🇹🇨 Turks and Caicos | 46,062 | 0.0 |
| 🇸🇽 Sint Maarten | 44,222 | 0.0 |
| 🇦🇸 American Samoa | 43,914 | 0.0 |
| 🇲🇭 Marshall Islands | 41,996 | 0.0 |
| 🇱🇮 Liechtenstein | indo | 0.0 |
| 🇲🇨 Monaco | 36,297 | 0.0 |
| 🇸🇲 San Marino | 33,642 | 0.0 |
| 🇬🇮 Gibraltar | 32,688 | 0.0 |
| 🇲🇫 Saint Martin | 32,077 | 0.0 |
| 🇻🇬 British Virgin Islands | 31,538 | 0.0 |
| 🇧🇶 Caribbean Netherlands | 27,148 | 0.0 |
| 🇵🇼 Palau | 18,058 | 0.0 |
| 🇨🇰 Cook Islands | 17,044 | 0.0 |
| 🇦🇮 Anguilla | 15,899 | 0.0 |
| 🇳🇷 Nauru | 12,780 | 0.0 |
| 🇼🇫 Wallis & Futuna | 11,502 | 0.0 |
| 🇹🇻 Tuvalu | 11,396 | 0.0 |
| 🇧🇱 Saint Barthelemy | 10,994 | 0.0 |
| 🇵🇲 Saint Pierre & Miquelon | 5,840 | 0.0 |
| 🇸🇭 Saint Helena | 5,314 | 0.0 |
| 🇲🇸 Montserrat | 4,386 | 0.0 |
| 🇫🇰 Falkland Islands | 3,791 | 0.0 |
| 🇳🇺 Niue | 1,935 | 0.0 |
| 🇹🇰 Tokelau | 1,893 | 0.0 |
| 🇻🇦 Holy See | 518 | 0.0 |
Africa is the second most populated continent with 182 out of 1,000 people, led by Nigeria (28), Ethiopia (16) and Egypt (14). As of July 2023, Africa’s total population stood at an estimated 1.5 billion people.
Despite seeing a decline in population over the last decades, Europe still is the third in terms of total population, making up 92 out of 1,000 people and led by Russia (18), Turkey (11), and Germany (10).
If the world only had 1,000 people, North America would have only 75 inhabitants, with 42 in the United States. Meanwhile, South America would account for 55 people led by 27 from Brazil, and Oceania would have just 5 people (with 3 in Australia).
Nigeria to Pass U.S. as World’s 3rd Most Populous Country
While population projections to the end of the century do differ, they mostly agree on the same general principle: the global population is rising but that growth rate is slowing. Eventually the population will peak (sometime between 2064-2086) and begin shrinking from there.
Over the next few decades, the ranking of the most populous countries will likely remain relatively unchanged, with India and China at the top of the pecking order. Shortly after 2050, however, the population of Nigeria is projected by some sources to surpass that of the United States and become the third-largest country in the world.
Other countries expected to see significant growth in population are the Democratic Republic of the Congo, Pakistan, Ethiopia, Tanzania, the U.S., Uganda, and Indonesia.


Demographics
Mapped: U.S. Immigrants by Region
This map shows which regions U.S. immigrants came from, highlighting Asia and Latin America as the biggest sources.


Breaking Down America’s Immigrant Population
This was originally posted on our Voronoi app. Download the app for free on iOS or Android and discover incredible data-driven charts from a variety of trusted sources.
The United States is home to more immigrants than any other nation, surpassing the combined totals of the next four countries: Germany, Saudi Arabia, Russia, and the United Kingdom.
To add context to this impressive fact, we’ve illustrated the regions from which U.S. immigrants originated. “Immigrants” in this context refers to individuals who are residing in the United States but were not U.S. citizens at birth.
These statistics were sourced from the Migration Policy Institute, which analyzed data from the U.S. Census Bureau’s 2022 American Community Survey (ACS).
U.S. Immigrants by Region
From this graphic, we can see that Asia and Latin America emerge as the primary sources of immigration, collectively accounting for 81% of America’s 46.2 million immigrants.
| Region | # of Immigrants | % of Total |
|---|---|---|
| Europe | 4,728,948 | 10 |
| Asia | 14,349,080 | 31 |
| Africa | 2,752,965 | 6 |
| Oceania | 288,560 | 1 |
| Northern America | 828,702 | 2 |
| Latin America | 23,233,834 | 50 |
| Total | 46,182,089 | 100 |
Latin America alone contributes half of the immigrant population. Mexico stands out as the largest contributor to U.S. immigration, with 10.7 million immigrants, attributable to its geographical proximity and historical ties.
Economic factors, including wage disparity and employment opportunities, drive many Mexicans to seek better prospects north of the border.
From Asia, the two largest country sources are China (2.2 million) and India (2.8 million).
Learn More About U.S. Immigration From Visual Capitalist
If you enjoyed this post, be sure to check out Why Do People Immigrate to the U.S.? This visualization shows the different reasons why immigrants chose to come to America in 2021.

-

 Technology5 days ago
Mapped: The Number of AI Startups By Country
-

 Markets2 weeks ago
The Best U.S. Companies to Work for According to LinkedIn
-

 Economy2 weeks ago
Ranked: The Top 20 Countries in Debt to China
-

 Politics2 weeks ago
Charted: Trust in Government Institutions by G7 Countries
-

 Energy2 weeks ago
Mapped: The Age of Energy Projects in Interconnection Queues, by State
-

 Mining2 weeks ago
Visualizing Global Gold Production in 2023
-

 Markets1 week ago
Visualized: Interest Rate Forecasts for Advanced Economies
-

 Economy1 week ago
The Most Valuable Companies in Major EU Economies