Misc
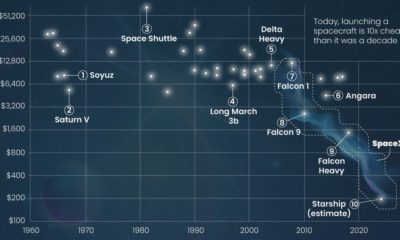
Razor Thin: A New Perspective on Earth’s Atmosphere


Razor Thin: A New Perspective on Earth’s Atmosphere
Earth is the only known planet that sustains life. Its atmosphere provides us with oxygen, protects us from the Sun’s radiation, and creates the barometric pressure needed so water stays liquid on our planet.
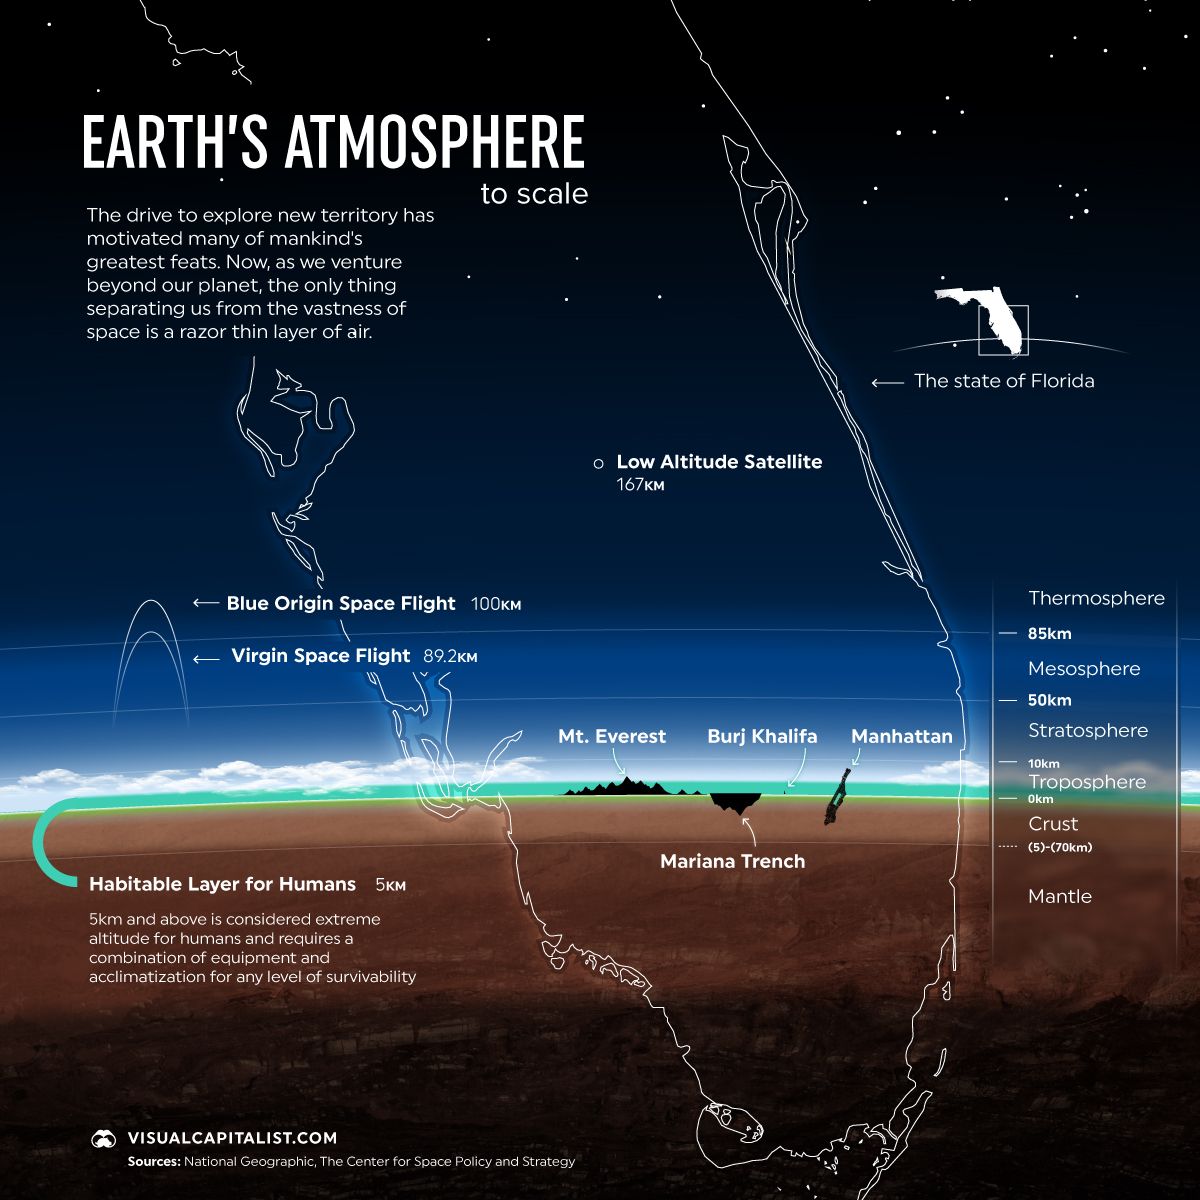
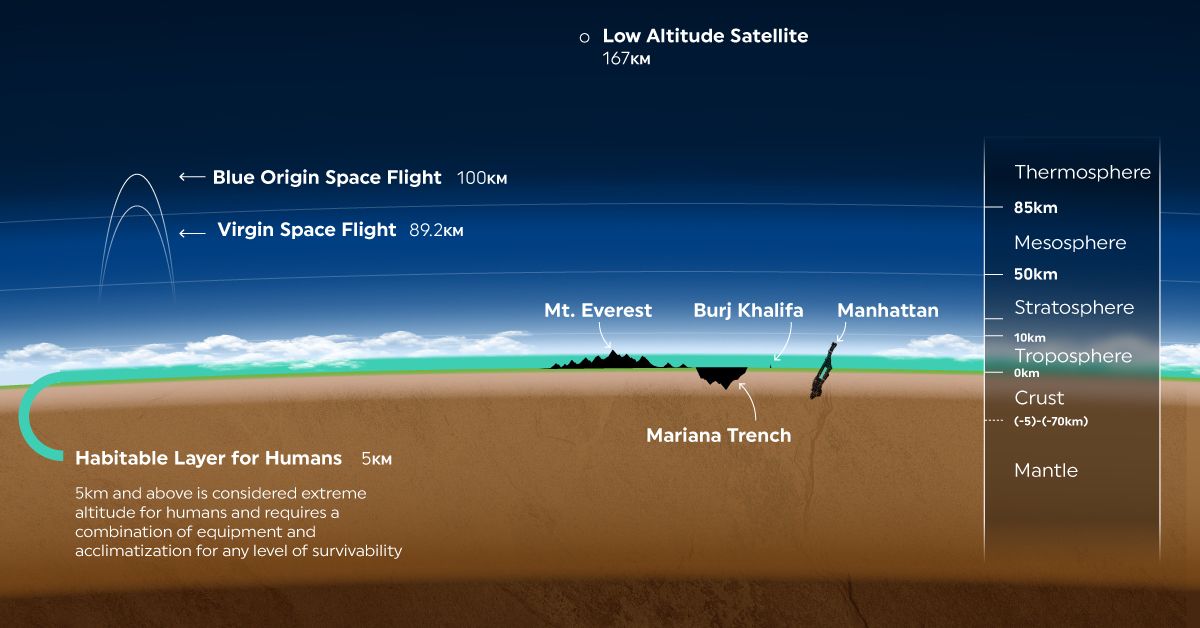
But while Earth’s atmosphere stretches for about 10,000 km (6,200 miles) above the planet’s surface, only a thin layer is actually habitable.
This graphic, inspired by Andrew Winter, shows just how small Earth’s “habitable zone” is, using the state of Florida as a point of reference.
Earth’s Like an Onion: It Has Layers
Our planet’s atmosphere is made up of a unique cocktail of gases—roughly 78% nitrogen and 21% oxygen, with trace amounts of water, argon, carbon dioxide, and other gases.
It’s separated into five different layers:
- Exosphere: The uppermost layer of our atmosphere that melds into outer space.
- Thermosphere: Begins at around 80 km (50 miles) above sea level and extends to approximately 600 km (372 miles), reaching temperatures as high as 2,000°C (3,600°F).
- Mesosphere: Around 30 km (19 miles) in range, meteors burn as they pass through this layer, creating “shooting stars.”
- Stratosphere: Home to the ozone layer, which is responsible for absorbing a majority of the sun’s radiation.
- Troposphere: The closest layer to ground. It stretches about 7–15 kilometers (5–10 miles) from the surface.
The troposphere makes up approximately 75-80% of the atmosphere’s mass, as it’s where most of the dust, ash, and water vapor are stored. But only a part of this layer is suitable for human life—in fact, the atmosphere’s habitable zone is so small, several mountain ranges extend beyond it.
Reaching Into Earth’s Atmosphere: Extremely High Altitudes
Elevations above 5,500 meters (18,000 ft) are considered extremely high altitude and require special equipment and/or acclimatization in order to survive. Even then, those who choose to venture to extreme heights run the risk of getting altitude sickness.
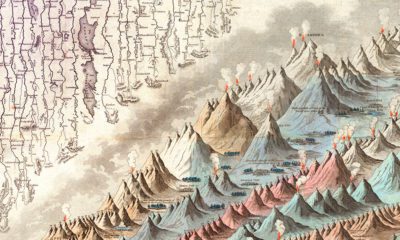
When it comes to the world’s tallest mountain ranges, the Himalayas are the highest. At their peak, Mount Everest, the Himalayas reach 8,848 m (29,000 ft) above sea level.
| Mountain range | Highest mountain | Height | Countries |
|---|---|---|---|
| Himalayas | Mount Everest | 8,848 m | Nepal, China |
| Karakoram | K2 | 8,611 m | Pakistan |
| Hindu Kush | Tirich Mir | 7,708 m | Pakistan |
| Kongur Shan | Kongur Tagh | 7,649 m | China |
| Daxue Mountains | Mount Gongga | 7,556 m | China |
| Pamir Mountains | Ismoil Somoni Peak | 7,495 m | Tajikistan |
| Kakshaal Too | Jengish Chokusu | 7,439 m | China, Kyrgyzstan |
| Nyenchen Tanglha Mountains | Gyala Peri | 7,294 m | China |
| Andes | Aconcagua | 6,960 m | Argentina |
| Kunlun Mountains | Chakragil | 6,760 m | China |
| Cordillera de la Ramada | Mercedario | 6,720 m | Argentina |
| Tian Shan | Xuelian Feng | 6,627 m | China |
| Hindu Raj | Buni Zom | 6,542 m | Pakistan |
| Cordillera Occidental | Chimborazo | 6,263 m | Ecuador |
| Alaska Range | Denali | 6,191 m | USA |
| Saint Elias Mountains | Mount Logan | 5,959 m | Canada |
| Eastern Rift mountains | Mount Kilimanjaro | 5,895 m | Tanzania |
| Sierra Nevada de Santa Marta | Pico Cristóbal Colón | 5,700 m | Colombia |
| Caucasus Mountains | Mount Elbrus | 5,642 m | Russia |
| Trans-Mexican Volcanic Belt | Pico de Orizaba | 5,636 m | Mexico |
| Alborz | Mount Damavand | 5,610 m | Iran |
| Yun Range | Jade Dragon Snow Mountain | 5,596 m | China |
| Bogda Shan | Bogda Peak | 5,445 m | China |
| Cordillera Oriental | Ritacuba Blanco | 5,410 m | Colombia |
| Armenian Highlands | Mount Ararat | 5,137 m | Turkey |
| Rwenzori Mountains | Mount Stanley | 5,109 m | Congo, Uganda |
Despite the dangers of extreme altitude, hundreds of mountaineers attempt to climb Mount Everest each year. On Everest, the region above 8,000 m (26,000 feet) is referred to as the “death zone,” and climbers have to bring bottled oxygen on their trek in order to survive.
Life Beyond Earth
Earth is the only known planet with an atmosphere we can survive in. And even on Earth, certain areas are considered dead zones.
But there may be other life forms out in the galaxy that we haven’t discovered. Recent research in The Astrophysical Journal predicts there are at least 36 intelligent civilizations throughout the galaxy today.
So life may very well exist beyond Earth. It just might look a bit different than we’re used to.


VC+
VC+: Get Our Key Takeaways From the IMF’s World Economic Outlook
A sneak preview of the exclusive VC+ Special Dispatch—your shortcut to understanding IMF’s World Economic Outlook report.

Have you read IMF’s latest World Economic Outlook yet? At a daunting 202 pages, we don’t blame you if it’s still on your to-do list.
But don’t worry, you don’t need to read the whole April release, because we’ve already done the hard work for you.
To save you time and effort, the Visual Capitalist team has compiled a visual analysis of everything you need to know from the report—and our VC+ Special Dispatch is available exclusively to VC+ members. All you need to do is log into the VC+ Archive.
If you’re not already subscribed to VC+, make sure you sign up now to access the full analysis of the IMF report, and more (we release similar deep dives every week).
For now, here’s what VC+ members get to see.
Your Shortcut to Understanding IMF’s World Economic Outlook
With long and short-term growth prospects declining for many countries around the world, this Special Dispatch offers a visual analysis of the key figures and takeaways from the IMF’s report including:
- The global decline in economic growth forecasts
- Real GDP growth and inflation forecasts for major nations in 2024
- When interest rate cuts will happen and interest rate forecasts
- How debt-to-GDP ratios have changed since 2000
- And much more!

Get the Full Breakdown in the Next VC+ Special Dispatch
VC+ members can access the full Special Dispatch by logging into the VC+ Archive, where you can also check out previous releases.
Make sure you join VC+ now to see exclusive charts and the full analysis of key takeaways from IMF’s World Economic Outlook.
Don’t miss out. Become a VC+ member today.
What You Get When You Become a VC+ Member
VC+ is Visual Capitalist’s premium subscription. As a member, you’ll get the following:
- Special Dispatches: Deep dive visual briefings on crucial reports and global trends
- Markets This Month: A snappy summary of the state of the markets and what to look out for
- The Trendline: Weekly curation of the best visualizations from across the globe
- Global Forecast Series: Our flagship annual report that covers everything you need to know related to the economy, markets, geopolitics, and the latest tech trends
- VC+ Archive: Hundreds of previously released VC+ briefings and reports that you’ve been missing out on, all in one dedicated hub
You can get all of the above, and more, by joining VC+ today.

-

 Debt1 week ago
How Debt-to-GDP Ratios Have Changed Since 2000
-

 Markets2 weeks ago
Ranked: The World’s Top Flight Routes, by Revenue
-

 Countries2 weeks ago
Population Projections: The World’s 6 Largest Countries in 2075
-

 Markets2 weeks ago
The Top 10 States by Real GDP Growth in 2023
-

 Demographics2 weeks ago
The Smallest Gender Wage Gaps in OECD Countries
-

 United States2 weeks ago
Where U.S. Inflation Hit the Hardest in March 2024
-

 Green2 weeks ago
Top Countries By Forest Growth Since 2001
-

 United States2 weeks ago
Ranked: The Largest U.S. Corporations by Number of Employees