Technology
The Tech Takeover of Advertising in One Chart
The Tech Takeover of Advertising in One Chart
The Chart of the Week is a weekly Visual Capitalist feature on Fridays.
Both Alphabet and Facebook have carefully worked at crafting their public images.
Most people see these companies as forward-looking tech companies that are shaping our future through high-flying initiatives like Google X or Oculus VR. They put money into big moonshots that could potentially change the world, and their actions are closely followed by people in and outside of the technology sector.
But, despite these other initiatives and some diligent messaging, make no mistake – both Alphabet and Facebook are media companies that get their money from one source.
Advertising makes up the vast majority of their business, and they’ve both become very good at it.
True Ad Dominance
Earlier this year, we put together a chart that broke down the revenues of the large tech companies:
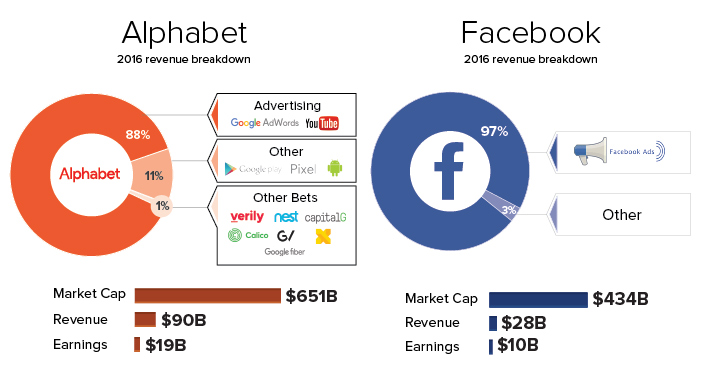
Facebook earns 97% of its revenue from ads. Meanwhile, Alphabet earns 88% from ads, while getting less than 1% of its revenue from moonshots (at least for now).
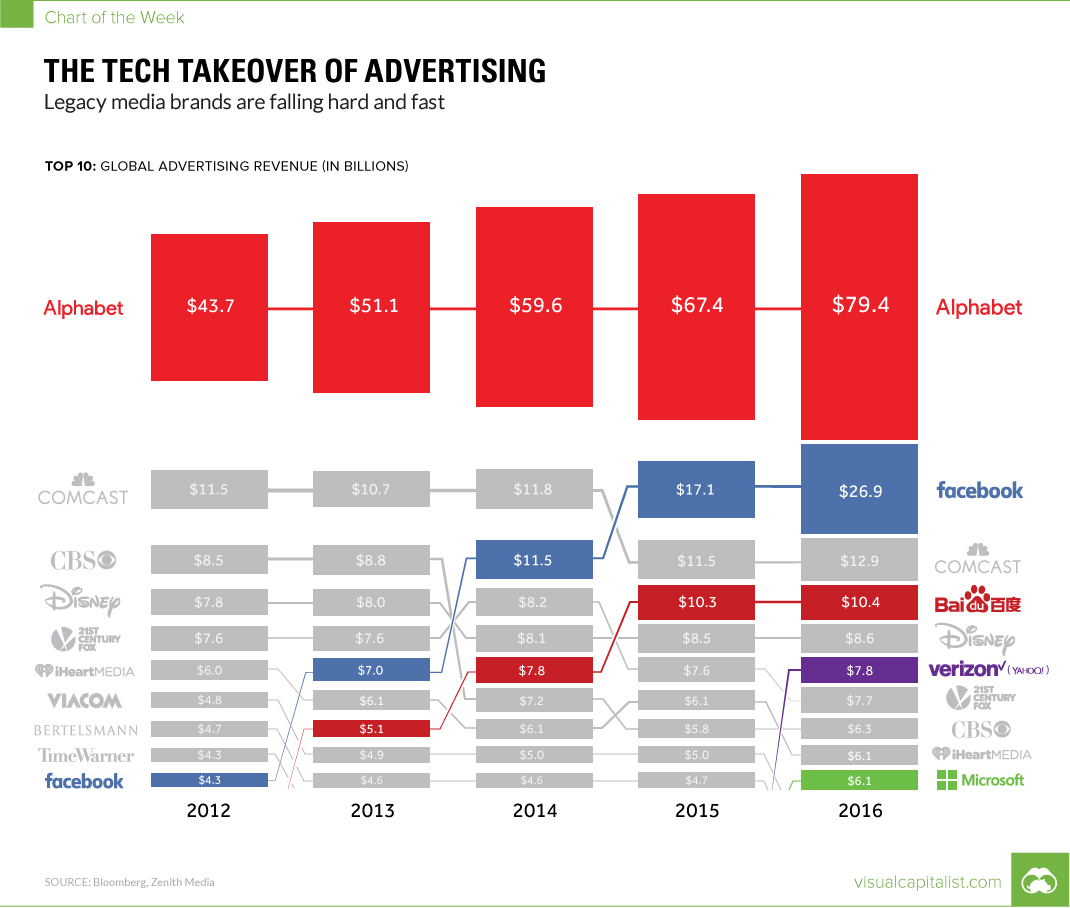
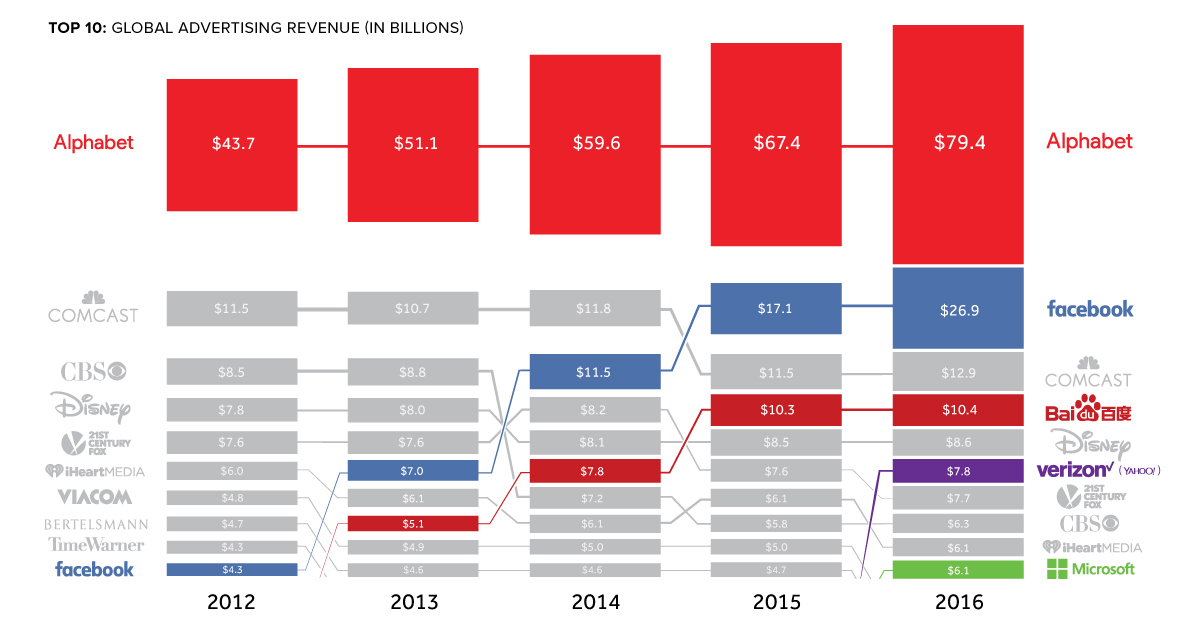
Alphabet and Facebook are so good at advertising, in fact, that traditional media can’t keep up – and as a result, companies like CBS, 21st Century Fox, and iHeartMedia are now fighting for scraps.
Three is a Crowd
It’s not just Alphabet and Facebook that have unlocked the secret to ad dominance. They were just the fastest to do so.
China’s search engine giant, Baidu, is quickly climbing the ranks as well. Even though growth slowed in 2016 due to changes in China’s ad rules, the company will eventually be the third-largest media giant in the world. If Baidu can bump ad revenues by another 20%, it’ll move past Comcast, which owns brands like NBCUniversal and Telemundo.
Microsoft is also making its presence felt, debuting in the Top 10 for the first time in 2016. Microsoft’s Bing search network is now in 36 countries, while making up 33% of the U.S. PC search market. On top of that, the company also acquired LinkedIn, which now contributes $1 billion in revenue to the coffers.
The sea change is still in process – but in a couple years, there may not be a single traditional media that makes the top five list for global ad revenues. The tech takeover continues.


Technology
Visualizing AI Patents by Country
See which countries have been granted the most AI patents each year, from 2012 to 2022.


Visualizing AI Patents by Country
This was originally posted on our Voronoi app. Download the app for free on iOS or Android and discover incredible data-driven charts from a variety of trusted sources.
This infographic shows the number of AI-related patents granted each year from 2010 to 2022 (latest data available). These figures come from the Center for Security and Emerging Technology (CSET), accessed via Stanford University’s 2024 AI Index Report.
From this data, we can see that China first overtook the U.S. in 2013. Since then, the country has seen enormous growth in the number of AI patents granted each year.
| Year | China | EU and UK | U.S. | RoW | Global Total |
|---|---|---|---|---|---|
| 2010 | 307 | 137 | 984 | 571 | 1,999 |
| 2011 | 516 | 129 | 980 | 581 | 2,206 |
| 2012 | 926 | 112 | 950 | 660 | 2,648 |
| 2013 | 1,035 | 91 | 970 | 627 | 2,723 |
| 2014 | 1,278 | 97 | 1,078 | 667 | 3,120 |
| 2015 | 1,721 | 110 | 1,135 | 539 | 3,505 |
| 2016 | 1,621 | 128 | 1,298 | 714 | 3,761 |
| 2017 | 2,428 | 144 | 1,489 | 1,075 | 5,136 |
| 2018 | 4,741 | 155 | 1,674 | 1,574 | 8,144 |
| 2019 | 9,530 | 322 | 3,211 | 2,720 | 15,783 |
| 2020 | 13,071 | 406 | 5,441 | 4,455 | 23,373 |
| 2021 | 21,907 | 623 | 8,219 | 7,519 | 38,268 |
| 2022 | 35,315 | 1,173 | 12,077 | 13,699 | 62,264 |
In 2022, China was granted more patents than every other country combined.
While this suggests that the country is very active in researching the field of artificial intelligence, it doesn’t necessarily mean that China is the farthest in terms of capability.
Key Facts About AI Patents
According to CSET, AI patents relate to mathematical relationships and algorithms, which are considered abstract ideas under patent law. They can also have different meaning, depending on where they are filed.
In the U.S., AI patenting is concentrated amongst large companies including IBM, Microsoft, and Google. On the other hand, AI patenting in China is more distributed across government organizations, universities, and tech firms (e.g. Tencent).
In terms of focus area, China’s patents are typically related to computer vision, a field of AI that enables computers and systems to interpret visual data and inputs. Meanwhile America’s efforts are more evenly distributed across research fields.
Learn More About AI From Visual Capitalist
If you want to see more data visualizations on artificial intelligence, check out this graphic that shows which job departments will be impacted by AI the most.

-

 Mining1 week ago
Gold vs. S&P 500: Which Has Grown More Over Five Years?
-

 Markets2 weeks ago
Ranked: The Most Valuable Housing Markets in America
-

 Money2 weeks ago
Which States Have the Highest Minimum Wage in America?
-

 AI2 weeks ago
Ranked: Semiconductor Companies by Industry Revenue Share
-

 Markets2 weeks ago
Ranked: The World’s Top Flight Routes, by Revenue
-

 Countries2 weeks ago
Population Projections: The World’s 6 Largest Countries in 2075
-

 Markets2 weeks ago
The Top 10 States by Real GDP Growth in 2023
-

 Demographics2 weeks ago
The Smallest Gender Wage Gaps in OECD Countries