Energy
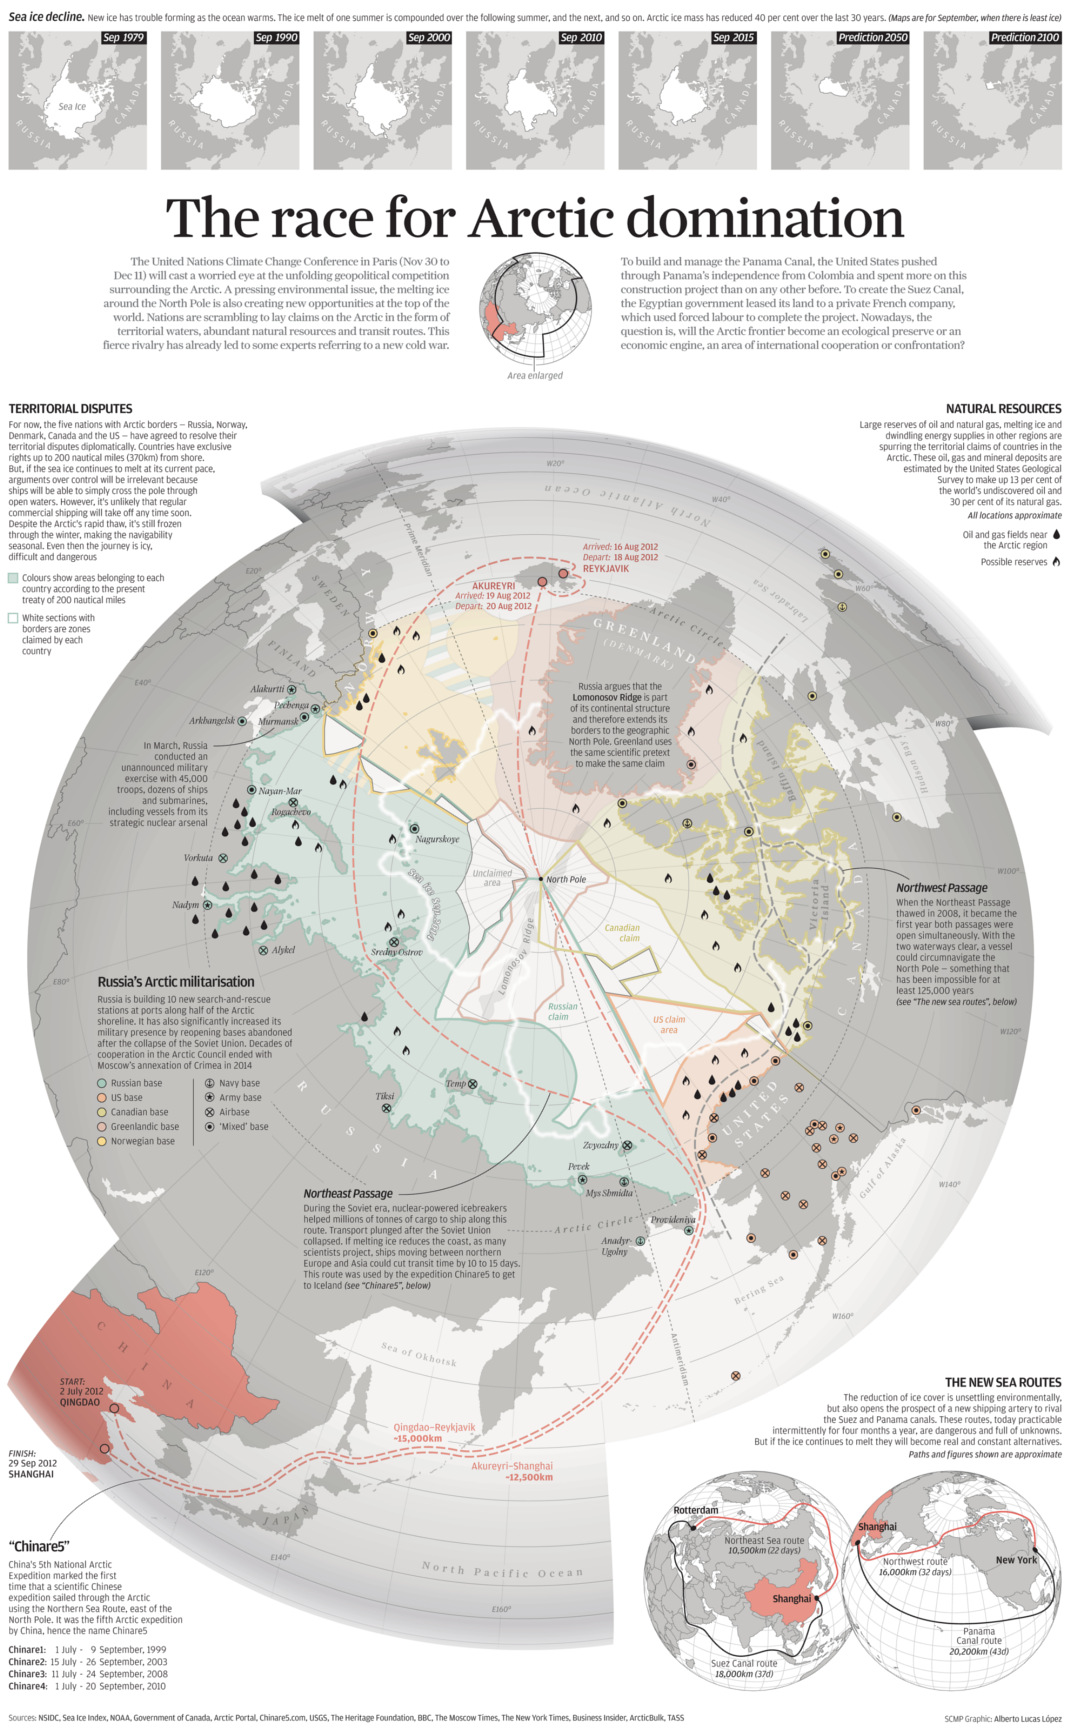
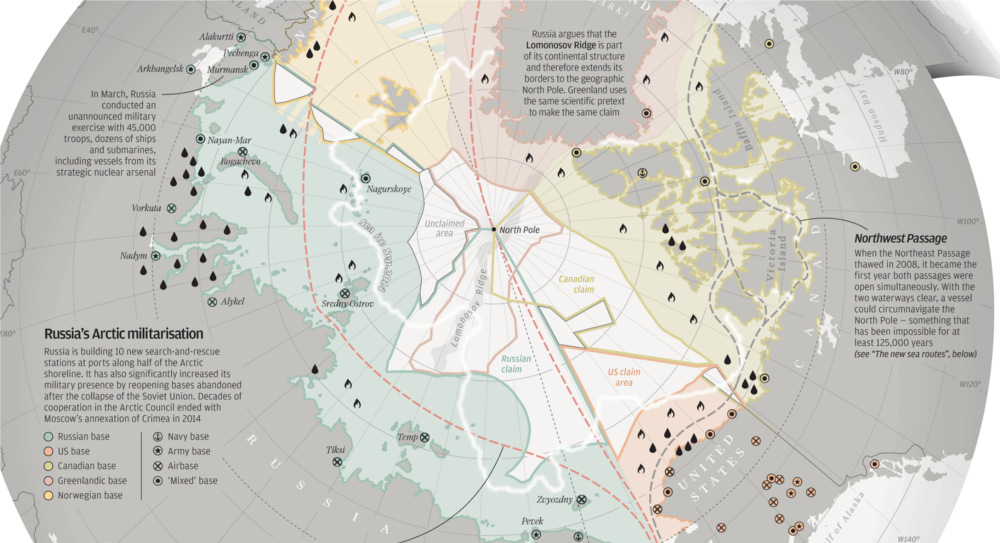
The Race for Arctic Domination
See full-size infographic for more legibility.
The Race for Arctic Domination
Note: see full-sized infographic for more legibility.
In the year 1776, James Cook was dispatched from Great Britain on an important mission: to discover the Northwest Passage. The famed hypothetical route from the Pacific to the Atlantic was a primary motivation for many British expeditions to the New World. Such a route would expedite trade between Europe and Asia, creating wealth for the kingdoms and merchants that could navigate it. The British government tried to motivate explorers even more by putting into law that there would be a prize of £20,000 for whoever could make such a discovery.
After spending some time in Hawaii, Cook came at it from the Pacific side. He and his crew searched northwards along the long coast of British Columbia, and eventually made his way in between Alaska and Russia through the Bering Strait. Seeing nothing but icebergs, it became clear that there was no navigable passage that could be seen.
For close to 300 years, explorers had searched for such a route, but ice and cold made it ultimately impossible for the technology of the day. Even Robert McClure, who was credited with the discovery of the Passage, got stuck in ice for three winters near Banks Island and had to be rescued.
Today, these routes through Northern waters have regained importance. Over recent decades, ice has thawed in the Arctic and 2008 became the first year that both the Northeast Passage (North of Russia) and the Northwest Passage (North of Canada) were open to ships simultaneously. This means it may be the first time that a vessel could theoretically circumnavigate the North Pole in 125,000 years.
Not surprisingly, countries such as Russia, Canada, Norway, Denmark, and the United States have taken notice and are posturing accordingly. The thawing waterways of the Arctic are the potential home to shipping routes, natural resources, and other territorial claims. For example, the US Geological Service estimates that the Arctic is home to 13% of the world’s undiscovered oil, as well as 30% of its undiscovered natural gas.
However, nation-states are not the only group engaged in this Battle Royale. Environmentalists have also entered the ring, and they’ve already helped to deliver a solid takedown. In September 2015, Royal Dutch Shell announced that they would abandon their Arctic drilling campaign even after spending $7 billion on the well. Realistically, there were several reasons for the change of plans, but traction on behalf of environmentalists definitely played a key role.
While some experts are referring to this as a new Cold War (pun likely intended), the conquest for Arctic domination is certainly heating up.
Original graphic by: SCMP


Energy
Mapped: The Age of Energy Projects in Interconnection Queues, by State
This map shows how many energy projects are in interconnection queues by state and how long these projects have been queued up, on average.


Age of Energy Projects in Interconnection Queues, by State
This was originally posted on our Voronoi app. Download the app for free on iOS or Android and discover incredible data-driven charts from a variety of trusted sources.
By the end of 2023, more than 11,000 energy projects were in interconnection queues in the United States, waiting for a green-light from regional grid operators to proceed with construction.
This map, created in partnership with the National Public Utilities Council, maps out the average age of active energy projects in interconnection queues by state, using data from Berkeley Lab.
Interconnection Queues, Explained
Interconnection queues are lists of energy projects that have made interconnection requests to their regional grid operators. Once submitted, these requests formally initiate the impact study process that each project goes through before grid connection, forming waiting lists for approval known as interconnection queues.
In recent years, both the number and generation capacity of queued projects have surged in the United States, along with the length of time spent in queue.
According to Berkeley Lab, the amount of generation capacity entering queues each year has risen by more than 550% from 2015 to 2023, with average queue duration rising from 3 years to 5 years the same period.
As a result of the growing backlog, a large proportion of projects ultimately withdraw from queues, leading to only 19% of applications reaching commercial operations.
The Backlog: Number of Projects and Average Wait Times
Of the 11,000 active projects in U.S. queues at the end of 2023, Texas, California, and Virginia had the most in queue; 1,208, 947, and 743, respectively.
When looking at the average ages of these projects, all three states hovered around the national average of 34 months (2.83 years), with Texas sporting 28 months, California 33, and Virginia 34.
Vermont, Minnesota, Wisconsin, and Florida, on the other hand, had the highest average queue durations; 54, 49, 47, and 46 months, respectively.
Average Queue Duration by Project Type
At the end of 2023, more than 95% of the generation capacity in active interconnection queues was for emission-free resources. The table below provides a breakdown.
| Project Type | Average Queue Duration (As of 12/31/2023) | Number of Projects in Queue |
|---|---|---|
| Wind | 40 months | 841 |
| Solar | 34 months | 4,506 |
| Wind+Battery | 34 months | 76 |
| Solar+Battery | 27 months | 2,377 |
| Battery | 24 months | 2,818 |
Wind projects had the highest wait times at the end of 2023 with an average age of 40 months (3.33 years). Solar projects, on the other hand, made up more than 40% of projects in queue.
Overall, reducing the time that these renewable energy projects spend in queues can accelerate the transition to a low-carbon energy future.
According to the U.S. Department of Energy, enhancing data transparency, streamlining approval processes, promoting economic efficiency, and maintaining a reliable grid are some of the ways this growing backlog can be mitigated.

-

 Culture7 days ago
The World’s Top Media Franchises by All-Time Revenue
-

 Science2 weeks ago
Visualizing the Average Lifespans of Mammals
-

 Brands2 weeks ago
How Tech Logos Have Evolved Over Time
-

 Energy2 weeks ago
Ranked: The Top 10 EV Battery Manufacturers in 2023
-

 Countries2 weeks ago
Countries With the Largest Happiness Gains Since 2010
-

 Economy2 weeks ago
VC+: Get Our Key Takeaways From the IMF’s World Economic Outlook
-

 Demographics2 weeks ago
The Countries That Have Become Sadder Since 2010
-

 Money1 week ago
Charted: Who Has Savings in This Economy?