Markets
Retail Apocalypse: Everything You Need to Know
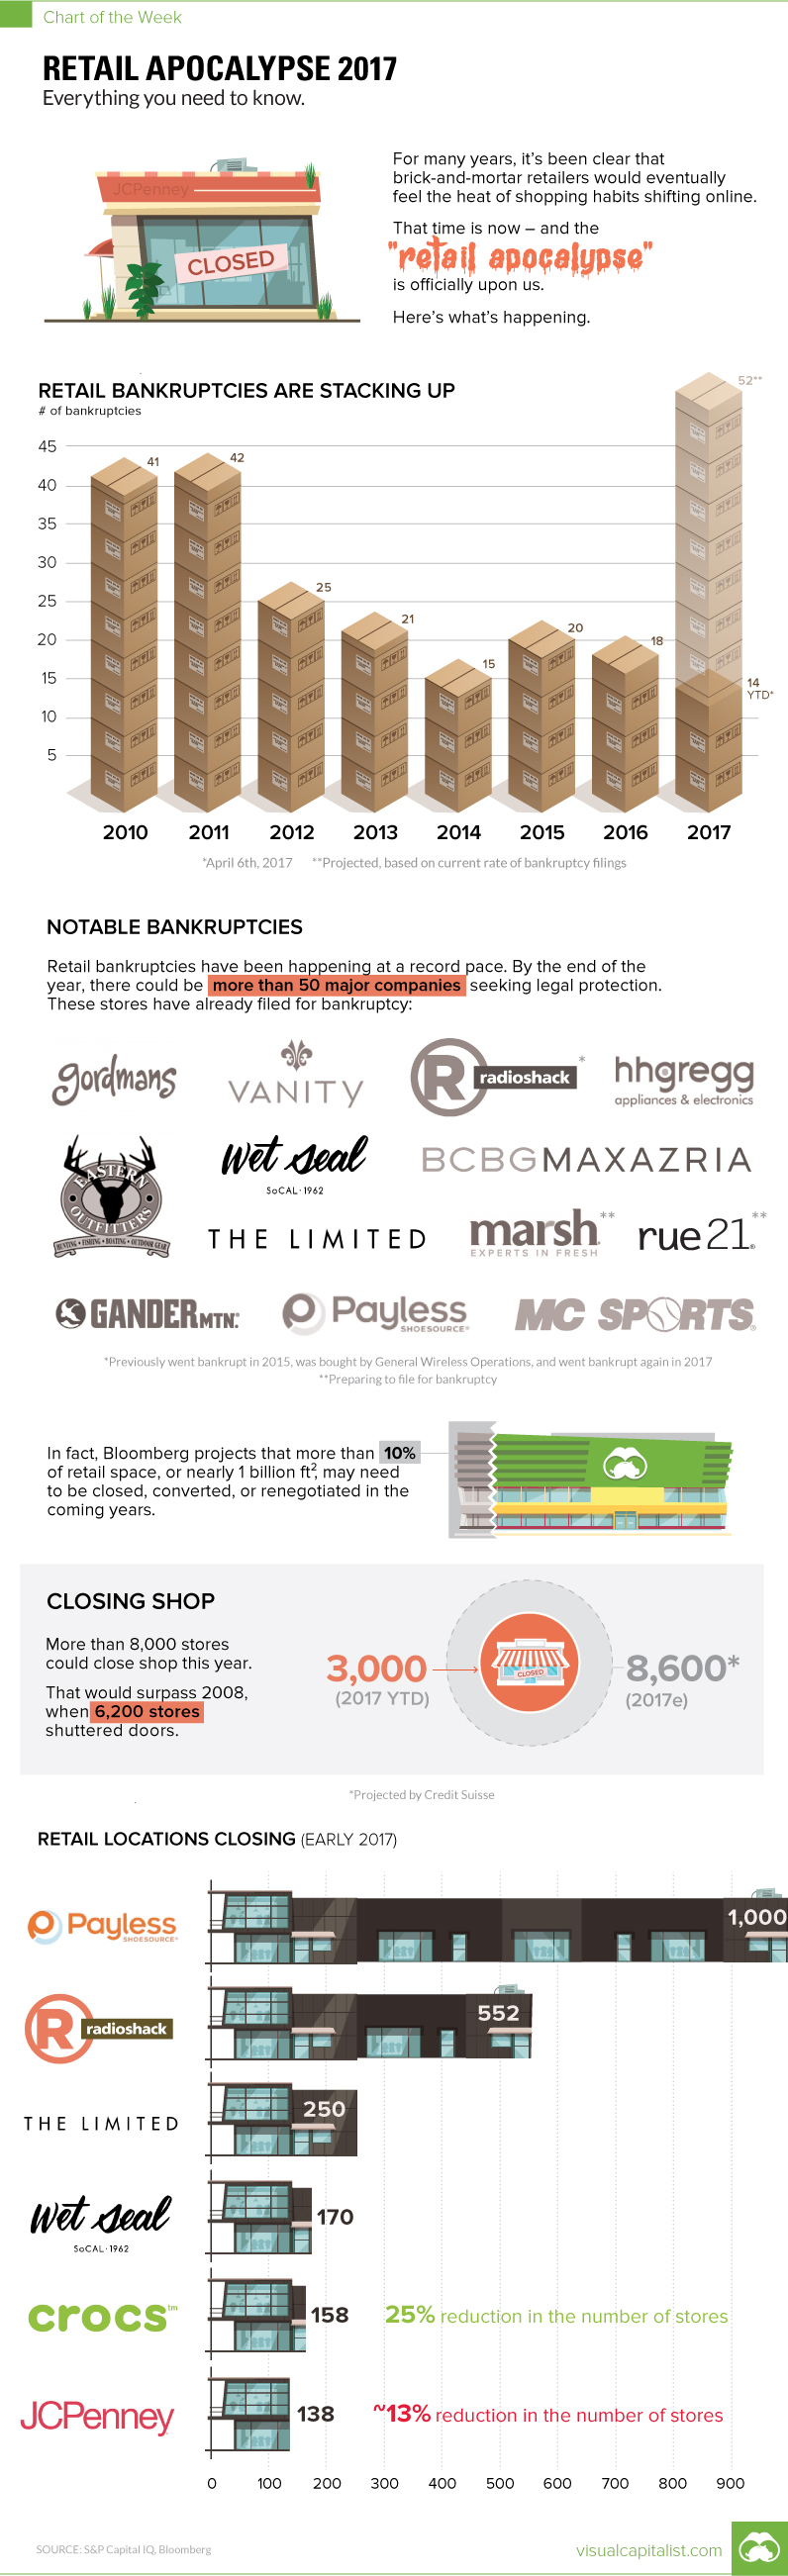
Chart: Retail Apocalypse 2017
The Chart of the Week is a weekly Visual Capitalist feature on Fridays.
The steady rise of online retail sales should have surprised no one.
Back in 2000, less than 1% of retail sales came from e-commerce. However, online sales have climbed each and every year since then, even through the Great Recession. By 2009, e-commerce made up about 4.0% of total retail sales, and today the latest number we have is 8.3%.
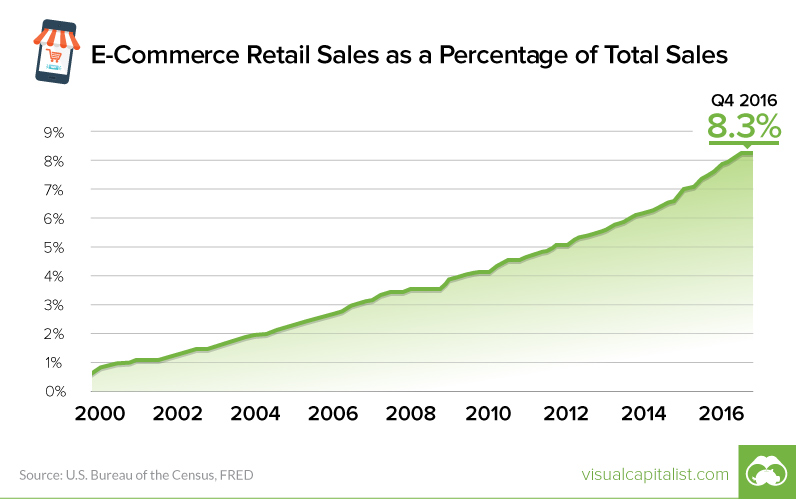
Here’s another knowledge bomb: it’s going to keep growing for the foreseeable future. Huge surprise, right?
Signs of a Reckoning
Retailers eye their competition relentlessly, and the sector also has notoriously thin margins.
The big retailers must have seen the “retail apocalypse” coming. The question is: what did they do about it?
Well, companies like Sears failed the shift to digital altogether – in fact, it is even widely speculated that the former behemoth might file for bankruptcy later this year.
The majority of other companies, on the other hand, are trying to combine “clicks and bricks” into a cohesive strategy. This sounds good in theory, but for established and sprawling brick and mortar retailers with excessive overhead costs, such tactics may not be enough to ward off this powerful secular trend. Target, for example, has had impressive growth in online sales, but they still only make up just 5% of total sales. As a result, the company’s robustness is also in doubt.
Wal-Mart took another route, which could potentially be the smartest one. The company hedged their bets by buying Jet.com, which was one of the fastest growing online retailers at the time. Later, they followed up by buying an online shoe retailer to help fill a perceived gap in footwear. Recent reports have surfaced, saying that these acquisitions are leading to staff shakeups, as the company re-orients its focus.
After all, going online is not just a tactic to boost sales in the new era of retailing. It has to be a mindset, and one that is central to the company’s strategy. Hopefully Wal-mart gets that, otherwise they will also be in trouble as well.
Apocalypse Now
In the midst of all of this is what is described as the “retail apocalypse”.
There are two main metrics that are pretty black and white:
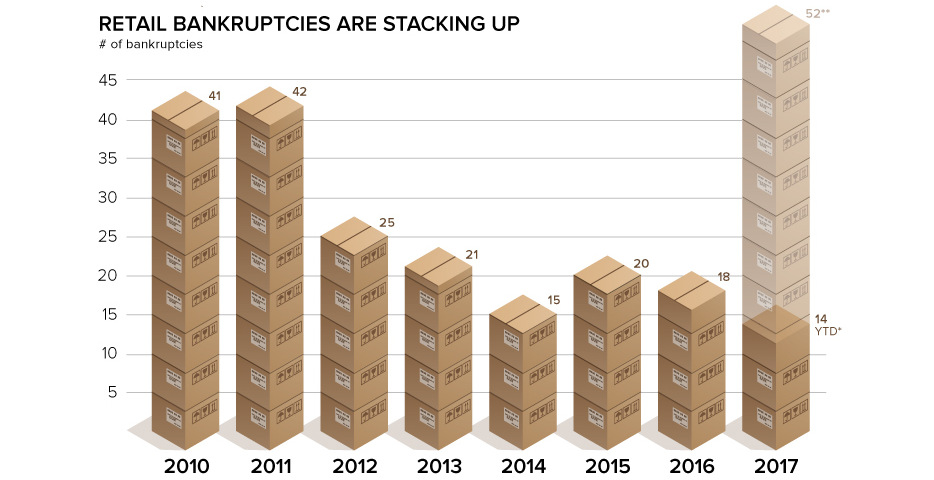
Number of Bankruptcies: We’re not even one-third through 2017, and we already have about as many retail bankruptcies as the previous year’s total. If they continue at the current pace, we could see over 50 retailers bankrupt by the end of the year.
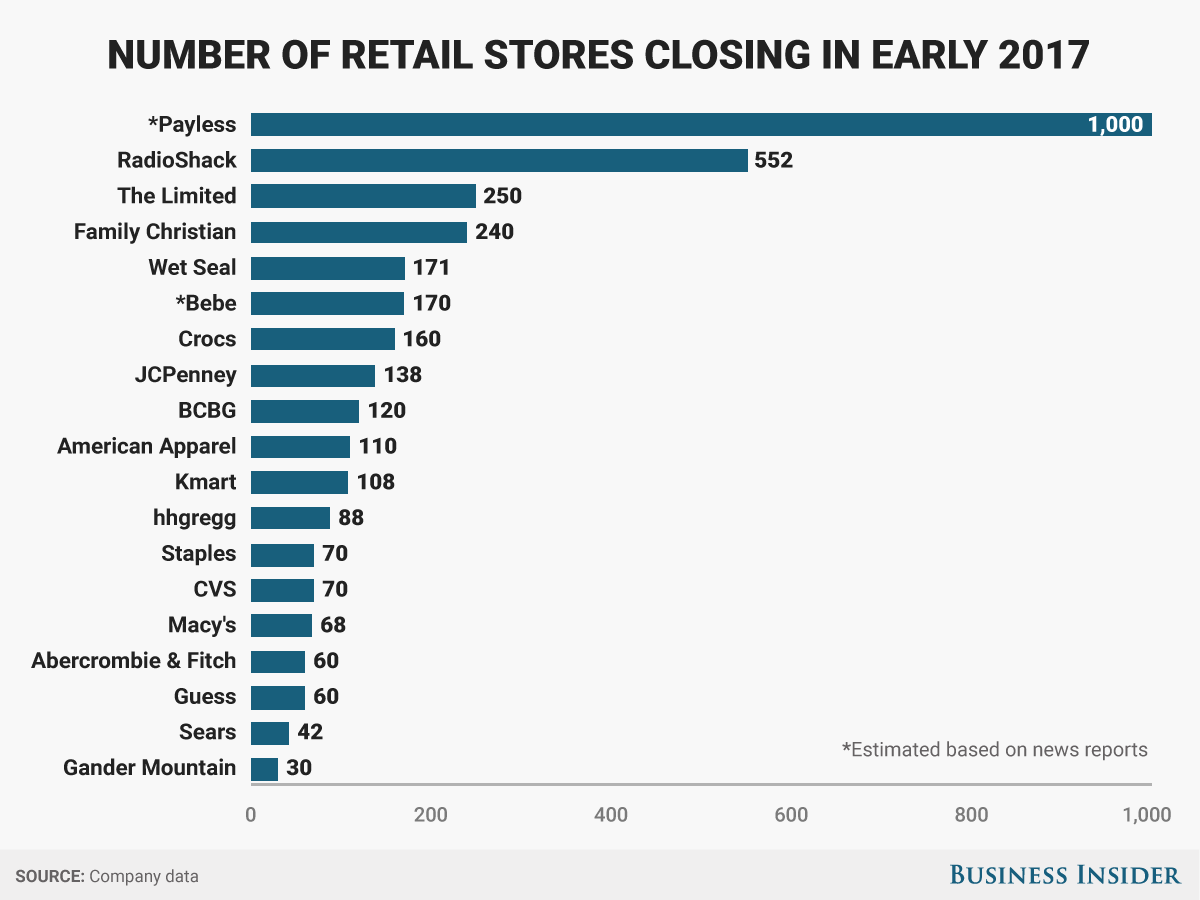
Number of Store Closings: So far we’ve seen roughly 3,000 store closings announced in 2017, and Credit Suisse estimates that could hit 8,600 by the end of the year. That would easily surpass 2008’s total, which was 6,200 closings, to be the worst year in recent memory.
Here’s some of the companies that have already filed for bankruptcy:
- Gordmans Stores
- Gander Mountain
- Radioshack (again)
- HHGregg
- BCBG Max Azria
- Eastern Outfitters
- Wet Seal
- The Limited
- Vanity Shop of Grand Forks
- Payless Inc.
- MC Sports
And here are the store closings occurring as a result of the retail apocalypse:


Markets
The European Stock Market: Attractive Valuations Offer Opportunities
On average, the European stock market has valuations that are nearly 50% lower than U.S. valuations. But how can you access the market?


European Stock Market: Attractive Valuations Offer Opportunities
Europe is known for some established brands, from L’Oréal to Louis Vuitton. However, the European stock market offers additional opportunities that may be lesser known.
The above infographic, sponsored by STOXX, outlines why investors may want to consider European stocks.
Attractive Valuations
Compared to most North American and Asian markets, European stocks offer lower or comparable valuations.
| Index | Price-to-Earnings Ratio | Price-to-Book Ratio |
|---|---|---|
| EURO STOXX 50 | 14.9 | 2.2 |
| STOXX Europe 600 | 14.4 | 2 |
| U.S. | 25.9 | 4.7 |
| Canada | 16.1 | 1.8 |
| Japan | 15.4 | 1.6 |
| Asia Pacific ex. China | 17.1 | 1.8 |
Data as of February 29, 2024. See graphic for full index names. Ratios based on trailing 12 month financials. The price to earnings ratio excludes companies with negative earnings.
On average, European valuations are nearly 50% lower than U.S. valuations, potentially offering an affordable entry point for investors.
Research also shows that lower price ratios have historically led to higher long-term returns.
Market Movements Not Closely Connected
Over the last decade, the European stock market had low-to-moderate correlation with North American and Asian equities.
The below chart shows correlations from February 2014 to February 2024. A value closer to zero indicates low correlation, while a value of one would indicate that two regions are moving in perfect unison.
| EURO STOXX 50 | STOXX EUROPE 600 | U.S. | Canada | Japan | Asia Pacific ex. China |
|
|---|---|---|---|---|---|---|
| EURO STOXX 50 | 1.00 | 0.97 | 0.55 | 0.67 | 0.24 | 0.43 |
| STOXX EUROPE 600 | 1.00 | 0.56 | 0.71 | 0.28 | 0.48 | |
| U.S. | 1.00 | 0.73 | 0.12 | 0.25 | ||
| Canada | 1.00 | 0.22 | 0.40 | |||
| Japan | 1.00 | 0.88 | ||||
| Asia Pacific ex. China | 1.00 |
Data is based on daily USD returns.
European equities had relatively independent market movements from North American and Asian markets. One contributing factor could be the differing sector weights in each market. For instance, technology makes up a quarter of the U.S. market, but health care and industrials dominate the broader European market.
Ultimately, European equities can enhance portfolio diversification and have the potential to mitigate risk for investors.
Tracking the Market
For investors interested in European equities, STOXX offers a variety of flagship indices:
| Index | Description | Market Cap |
|---|---|---|
| STOXX Europe 600 | Pan-regional, broad market | €10.5T |
| STOXX Developed Europe | Pan-regional, broad-market | €9.9T |
| STOXX Europe 600 ESG-X | Pan-regional, broad market, sustainability focus | €9.7T |
| STOXX Europe 50 | Pan-regional, blue-chip | €5.1T |
| EURO STOXX 50 | Eurozone, blue-chip | €3.5T |
Data is as of February 29, 2024. Market cap is free float, which represents the shares that are readily available for public trading on stock exchanges.
The EURO STOXX 50 tracks the Eurozone’s biggest and most traded companies. It also underlies one of the world’s largest ranges of ETFs and mutual funds. As of November 2023, there were €27.3 billion in ETFs and €23.5B in mutual fund assets under management tracking the index.
“For the past 25 years, the EURO STOXX 50 has served as an accurate, reliable and tradable representation of the Eurozone equity market.”
— Axel Lomholt, General Manager at STOXX
Partnering with STOXX to Track the European Stock Market
Are you interested in European equities? STOXX can be a valuable partner:
- Comprehensive, liquid and investable ecosystem
- European heritage, global reach
- Highly sophisticated customization capabilities
- Open architecture approach to using data
- Close partnerships with clients
- Part of ISS STOXX and Deutsche Börse Group
With a full suite of indices, STOXX can help you benchmark against the European stock market.
Learn how STOXX’s European indices offer liquid and effective market access.

-

 Economy1 day ago
Economic Growth Forecasts for G7 and BRICS Countries in 2024
The IMF has released its economic growth forecasts for 2024. How do the G7 and BRICS countries compare?
-

 Markets1 week ago
U.S. Debt Interest Payments Reach $1 Trillion
U.S. debt interest payments have surged past the $1 trillion dollar mark, amid high interest rates and an ever-expanding debt burden.
-

 United States2 weeks ago
Ranked: The Largest U.S. Corporations by Number of Employees
We visualized the top U.S. companies by employees, revealing the massive scale of retailers like Walmart, Target, and Home Depot.
-

 Markets2 weeks ago
The Top 10 States by Real GDP Growth in 2023
This graphic shows the states with the highest real GDP growth rate in 2023, largely propelled by the oil and gas boom.
-

 Markets2 weeks ago
Ranked: The World’s Top Flight Routes, by Revenue
In this graphic, we show the highest earning flight routes globally as air travel continued to rebound in 2023.
-

 Markets2 weeks ago
Ranked: The Most Valuable Housing Markets in America
The U.S. residential real estate market is worth a staggering $47.5 trillion. Here are the most valuable housing markets in the country.


-

 Mining1 week ago
Gold vs. S&P 500: Which Has Grown More Over Five Years?
-
Markets2 weeks ago
Ranked: The Most Valuable Housing Markets in America
-

 Money2 weeks ago
Which States Have the Highest Minimum Wage in America?
-

 AI2 weeks ago
Ranked: Semiconductor Companies by Industry Revenue Share
-
Markets2 weeks ago
Ranked: The World’s Top Flight Routes, by Revenue
-

 Demographics2 weeks ago
Population Projections: The World’s 6 Largest Countries in 2075
-
Markets2 weeks ago
The Top 10 States by Real GDP Growth in 2023
-

 Demographics2 weeks ago
The Smallest Gender Wage Gaps in OECD Countries