Misc
Ranked: The World’s Most Surveilled Cities
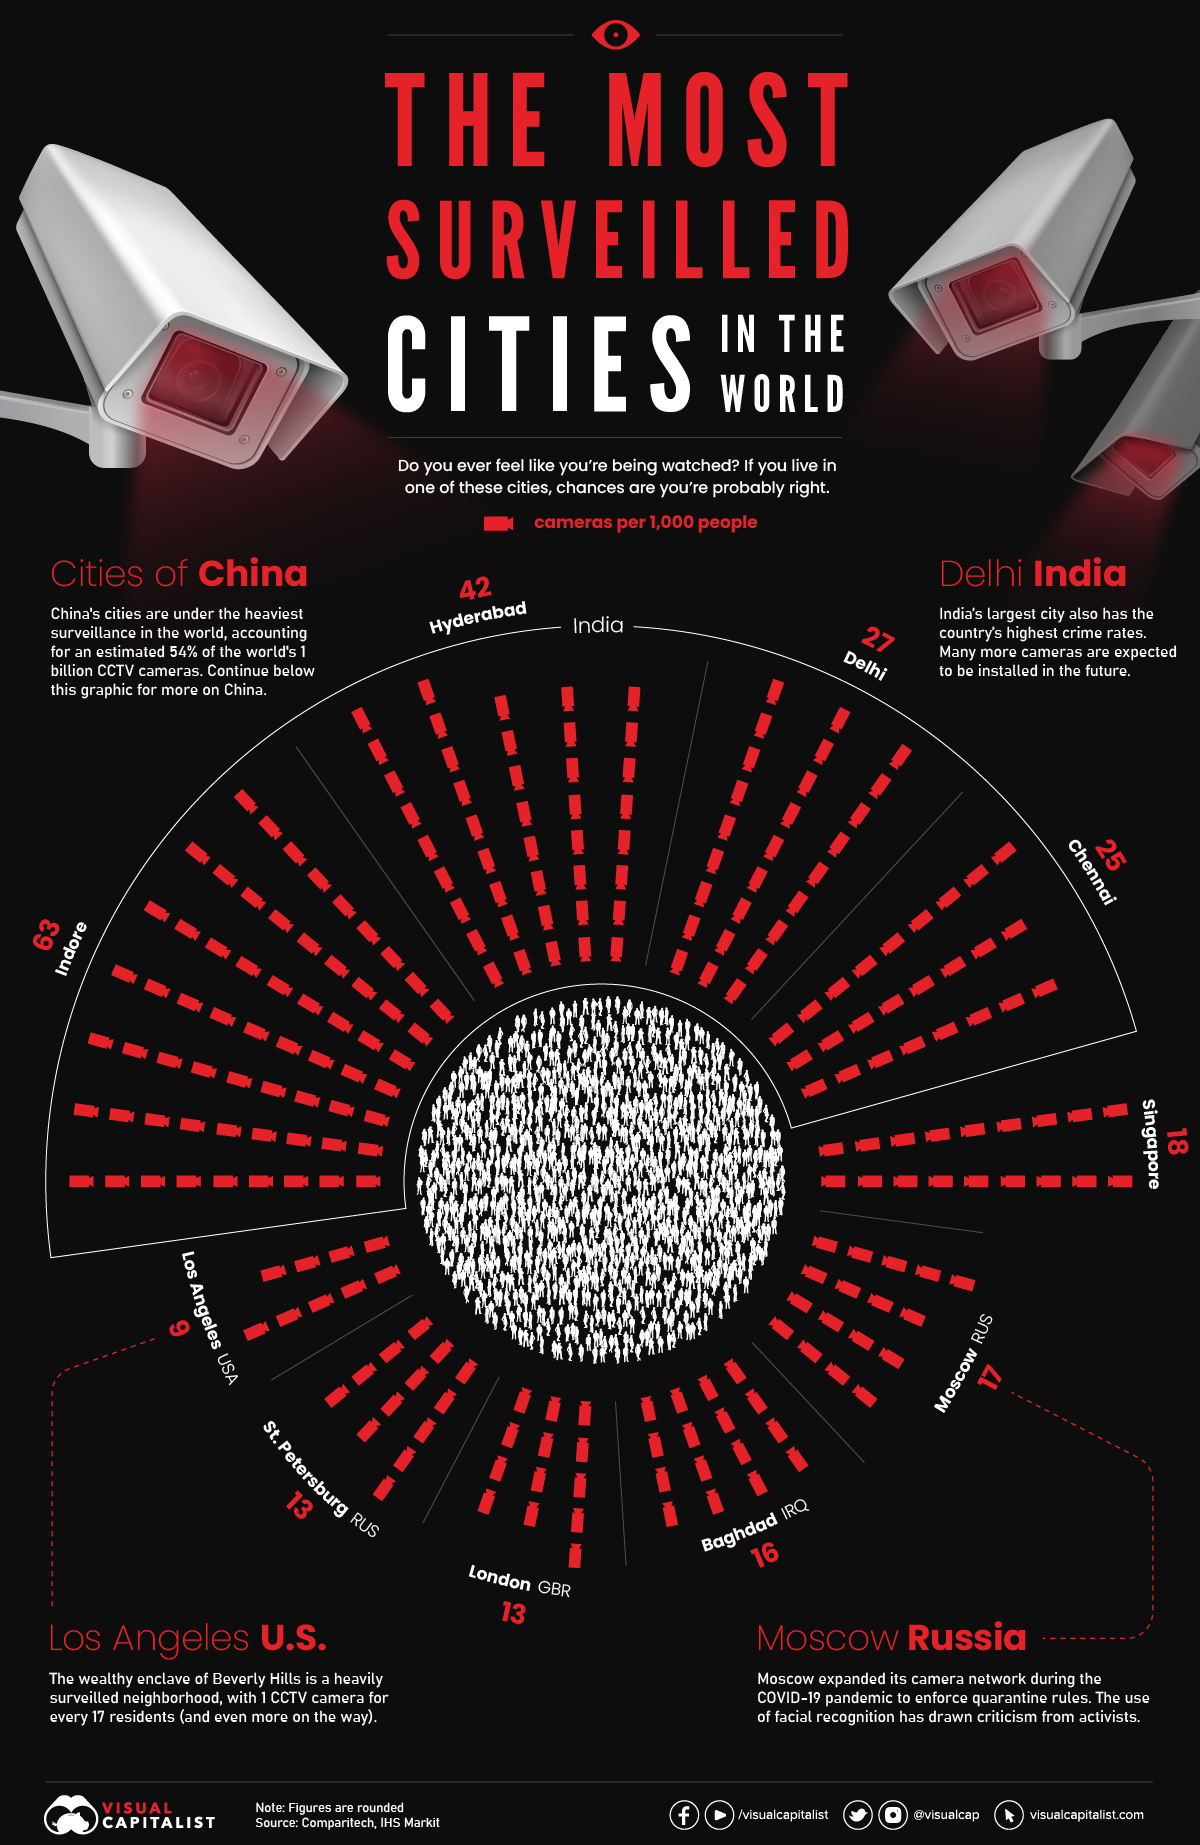


Ranked: The World’s Most Surveilled Cities
This may come as a surprise, but it wasn’t until 2007 that the global urban population overtook the rural population. At that time, the two groups were split nearly 50/50, with around 3.3 billion people apiece.
Today, the percentage of people living in urban areas has grown to over 55%, and is expected to reach 68% by 2050. Due to this trend, many of the world’s largest cities have become home to tens of millions of people.
In response to such incredible density, governments, businesses, and households have installed countless security cameras for various purposes including crime protection. To grasp the scale of this surveillance, we’ve taken data from a recent report by Comparitech to visualize the most surveilled cities in the world.
The List (Excluding China)
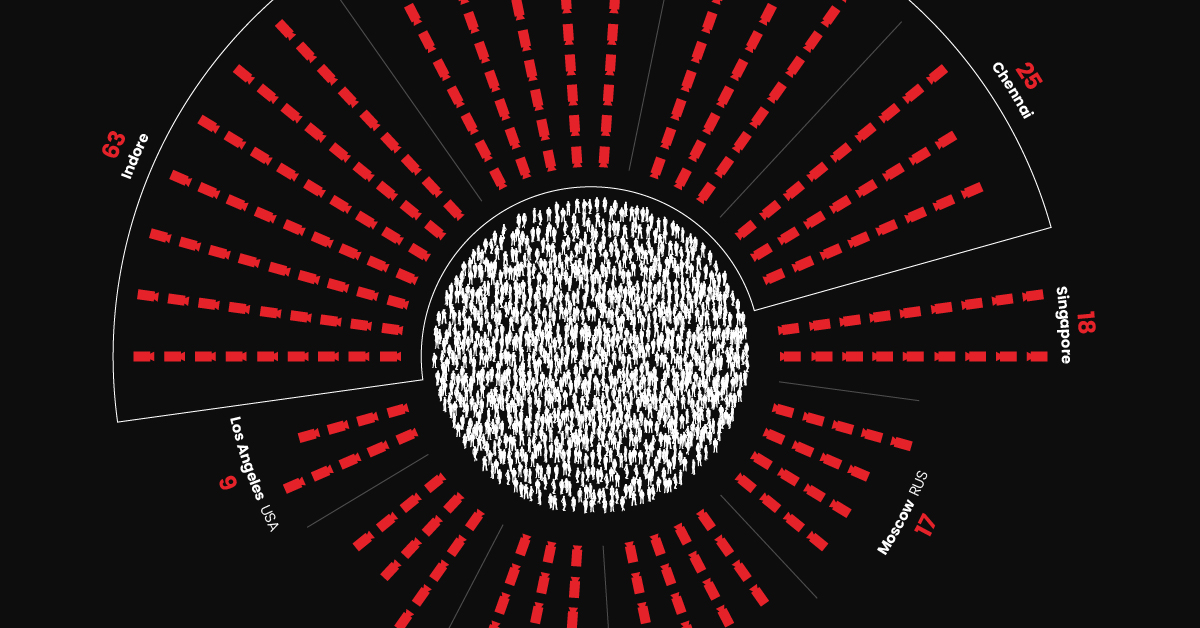
Excluding China for the time being, these are the world’s 10 most surveilled cities.
| City | Population | Number of Cameras | Cameras per 1,000 people |
|---|---|---|---|
| 🇮🇳 Indore, India | 3.2M | 200,600 | 63 |
| 🇮🇳 Hyderabad, India | 10.5M | 440,299 | 42 |
| 🇮🇳 Delhi, India | 16.3M | 436,600 | 27 |
| 🇮🇳 Chennai, India | 11.5M | 282,126 | 25 |
| 🇸🇬 Singapore | 6.0M | 108,981 | 18 |
| 🇷🇺 Moscow, Russia | 12.6M | 213,000 | 17 |
| 🇮🇶 Baghdad, Iraq | 7.5M | 120,000 | 16 |
| 🇬🇧 London, UK | 9.5M | 127,373 | 13 |
| 🇷🇺 St. Petersburg, Russia | 5.5M | 70,000 | 13 |
| 🇺🇸 Los Angeles, U.S. | 3.9M | 34,959 | 9 |
Figures rounded
The top four cities all belong to India, which is the world’s second largest country by population. Surveillance cameras are playing a major role in the country’s efforts to reduce crimes against women.
Further down the list are cities from a variety of countries. One of these is Russia, which has expanded its use of surveillance cameras in recent years. Given the country’s track record of human rights violations, activists are worried that facial recognition technology could become a tool of oppression.
The only U.S. city on the list is Los Angeles, which contains some of the country’s wealthiest neighborhoods and municipalities. That includes Beverly Hills, which according to the Los Angeles Times, has over 2,000 cameras for its population of 32,500. That translates to about 62 cameras per 1,000 people, meaning that Beverly Hills would finish at #2 in the global ranking if it were listed as a separate entity.
Surveillance in China
IHS Markit estimates that as of 2021, there are over 1 billion surveillance cameras installed worldwide. The firm also believes that 54% of these cameras are located in China.
Because of limited transparency, it’s impossible to pinpoint how many cameras are actually in each Chinese city. However, if we assume that China has 540 million cameras and divide that amongst its population of 1.46 billion, we can reasonably say that there are 373 cameras per 1,000 people (figures rounded).
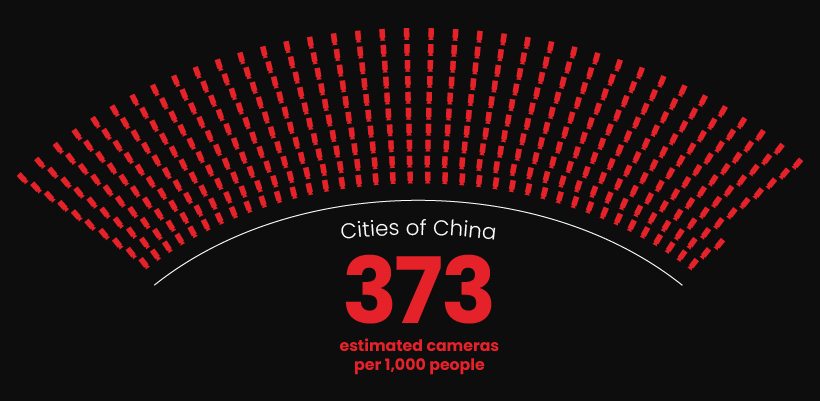
A limitation of this approach is that it assumes everyone in China lives in a city, which is far from reality. The most recent World Bank figures suggest that 37% of China’s population is rural, which equates to over 500 million people.
With this in mind, the number of cameras per 1,000 people in a Tier 1+ Chinese city (e.g. Shanghai) is likely far greater than 373.
More About China
China’s expansive use of cameras and facial recognition technology has been widely documented in the media. These networks enable the country’s social credit program, which gives local governments an unprecedented amount of oversight over its citizens.
For example, China’s camera networks can be used to verify ATM withdrawals, permit access into homes, and even publicly shame people for minor offences like jaywalking.
This might sound like a dystopian nightmare to Western audiences, but according to Chinese citizens, it’s mostly a good thing. In a 2018 survey of 2,209 citizens, 80% of respondents approved of social credit systems.
If you’re interested in learning more about surveillance in Chinese cities, consider this video from The Economist, which explores the opportunities and dangers of comprehensive state control.


Misc
Visualizing the Most Common Pets in the U.S.
Lions, tigers, and bears, oh my!—these animals do not feature on this list of popular American household pets.


Visualizing The Most Common Pets in the U.S.
This was originally posted on our Voronoi app. Download the app for free on iOS or Android and discover incredible data-driven charts from a variety of trusted sources.
In this graphic, we visualized the most common American household pets, based on 2023-2024 data from the American Pet Products Association (accessed via Forbes Advisor).
Figures represent the number of households that own each pet type, rather than the actual number of each animal. The “small animal” category includes hamsters, gerbils, rabbits, guinea pigs, chinchillas, mice, rats, and ferrets.
What is the Most Popular American Household Pet?
Based on this data, dogs—one of the first domesticated animals—are the most common pets in the United States. In fact, around 65 million households own a dog, and spend an average of $900 a year on their care.
| Rank | Species | Households |
|---|---|---|
| 1 | 🐶 Dog | 65M |
| 2 | 🐱 Cat | 47M |
| 3 | 🐟 Freshwater Fish | 11M |
| 4 | 🐰 Small Animals | 7M |
| 5 | 🐦 Bird | 6M |
| 6 | 🦎 Reptile | 6M |
| 7 | 🐴 Horse | 2M |
| 8 | 🐠 Saltwater Fish | 2M |
Note: Households can own multiple pets, and are counted for all relevant categories.
Cats rank second, at 47 million households, and these smaller felines are a little less expensive to own at $700/year according to Forbes estimates.
But aside from these two juggernauts, there are plenty of other common pet types found in households across the country.
Freshwater fish can be found in 11 million households, along with small animals—rabbits, hamsters, guinea pigs—in 7 million. Meanwhile, nearly 6 million homes have birds or reptiles.
Pet Ownership is on the Rise in America
Forbes found that 66% of all American households (numbering 87 million) own at least one pet, up from 56% in 1988. One third of these (29 million) own multiple pets.
A combination of factors is driving this increase: rising incomes, delayed childbirth, and of course the impact of the pandemic which nearly cleared out animal shelters across the globe.
America’s loneliness epidemic may also be a factor. Fledgling research has shown that single-individual households with pets recorded lower rates of loneliness during the pandemic than those without a pet.

-

 Science1 week ago
Visualizing the Average Lifespans of Mammals
-

 Markets2 weeks ago
The Top 10 States by Real GDP Growth in 2023
-

 Demographics2 weeks ago
The Smallest Gender Wage Gaps in OECD Countries
-

 United States2 weeks ago
Where U.S. Inflation Hit the Hardest in March 2024
-

 Green2 weeks ago
Top Countries By Forest Growth Since 2001
-

 United States2 weeks ago
Ranked: The Largest U.S. Corporations by Number of Employees
-

 Maps2 weeks ago
The Largest Earthquakes in the New York Area (1970-2024)
-

 Green2 weeks ago
Ranked: The Countries With the Most Air Pollution in 2023