Energy
The Next Big Hurdle for Oil and Gas is Water Use
In The Rime of the Ancient Mariner from 1834, English poet Samuel Taylor Coleridge famously quipped “Water, water, everywhere / But not a drop to drink”. The lines speak to the irony of sailing the high seas: there’s unfathomable amounts of water in every direction, but it’s definitely not going to quench the thirst of any sailor.
Surprisingly, the situation is not as different on land as you might think.
In some counties in the U.S., especially those with lots of oil and gas activity, there are billions of gallons of waste water, brackish water, or saline water that aren’t potable for human consumption. At the same time, these counties are receiving limited rainfall, and freshwater has become an increasingly scarce and valuable commodity.
Water Innovation is Needed
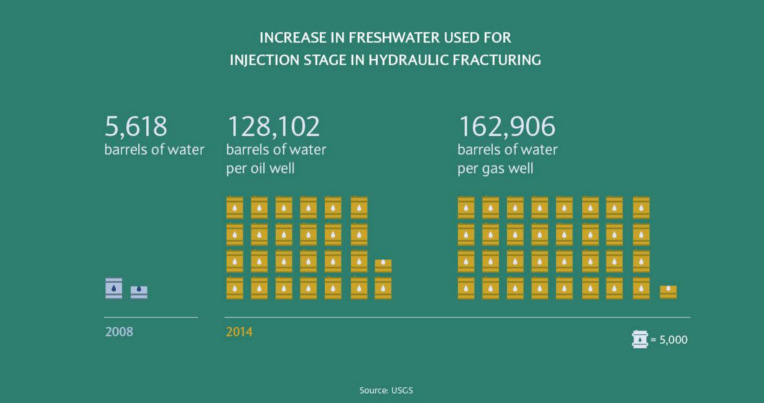
The fact is, horizontal drilling and fracking operations use large amounts of water. In 2008, an average of just 5,618 barrels of water were used for the injection stage of fracking according to the USGS. In 2014, that ballooned to 128,102 barrels of water for a oil well, and 162,906 barrels for a gas well.
Simultaneously, the Government Accountability Office estimates that 40 of 50 states have at least one region that will face some kind of water shortage by 2023. This crisis has increased social and regulatory pressures on oil and gas firms, while making the supply of usable water less dependable.
Today’s infographic comes to us from Barclays Bank, and it details this situation in depth. Further, Barclays explains how oil and gas companies will need to innovate their way out of the problem to secure new water supply and reduce costs – all while maintaining a social license to operate.

Barclays sees this problem as an opportunity: by re-thinking water use and disposal, and by turning recycled water into a new resource for other industries, oil and gas can decrease costs while giving a boost to their social license to operate.


Energy
Mapped: The Age of Energy Projects in Interconnection Queues, by State
This map shows how many energy projects are in interconnection queues by state and how long these projects have been queued up, on average.


Age of Energy Projects in Interconnection Queues, by State
This was originally posted on our Voronoi app. Download the app for free on iOS or Android and discover incredible data-driven charts from a variety of trusted sources.
By the end of 2023, more than 11,000 energy projects were in interconnection queues in the United States, waiting for a green-light from regional grid operators to proceed with construction.
This map, created in partnership with the National Public Utilities Council, maps out the average age of active energy projects in interconnection queues by state, using data from Berkeley Lab.
Interconnection Queues, Explained
Interconnection queues are lists of energy projects that have made interconnection requests to their regional grid operators. Once submitted, these requests formally initiate the impact study process that each project goes through before grid connection, forming waiting lists for approval known as interconnection queues.
In recent years, both the number and generation capacity of queued projects have surged in the United States, along with the length of time spent in queue.
According to Berkeley Lab, the amount of generation capacity entering queues each year has risen by more than 550% from 2015 to 2023, with average queue duration rising from 3 years to 5 years the same period.
As a result of the growing backlog, a large proportion of projects ultimately withdraw from queues, leading to only 19% of applications reaching commercial operations.
The Backlog: Number of Projects and Average Wait Times
Of the 11,000 active projects in U.S. queues at the end of 2023, Texas, California, and Virginia had the most in queue; 1,208, 947, and 743, respectively.
When looking at the average ages of these projects, all three states hovered around the national average of 34 months (2.83 years), with Texas sporting 28 months, California 33, and Virginia 34.
Vermont, Minnesota, Wisconsin, and Florida, on the other hand, had the highest average queue durations; 54, 49, 47, and 46 months, respectively.
Average Queue Duration by Project Type
At the end of 2023, more than 95% of the generation capacity in active interconnection queues was for emission-free resources. The table below provides a breakdown.
| Project Type | Average Queue Duration (As of 12/31/2023) | Number of Projects in Queue |
|---|---|---|
| Wind | 40 months | 841 |
| Solar | 34 months | 4,506 |
| Wind+Battery | 34 months | 76 |
| Solar+Battery | 27 months | 2,377 |
| Battery | 24 months | 2,818 |
Wind projects had the highest wait times at the end of 2023 with an average age of 40 months (3.33 years). Solar projects, on the other hand, made up more than 40% of projects in queue.
Overall, reducing the time that these renewable energy projects spend in queues can accelerate the transition to a low-carbon energy future.
According to the U.S. Department of Energy, enhancing data transparency, streamlining approval processes, promoting economic efficiency, and maintaining a reliable grid are some of the ways this growing backlog can be mitigated.

-

 Technology6 days ago
All of the Grants Given by the U.S. CHIPS Act
-

 Uranium2 weeks ago
The World’s Biggest Nuclear Energy Producers
-

 Education2 weeks ago
How Hard Is It to Get Into an Ivy League School?
-

 Debt2 weeks ago
How Debt-to-GDP Ratios Have Changed Since 2000
-

 Sports2 weeks ago
The Highest Earning Athletes in Seven Professional Sports
-

 Science2 weeks ago
Visualizing the Average Lifespans of Mammals
-

 Brands1 week ago
How Tech Logos Have Evolved Over Time
-

 Energy1 week ago
Ranked: The Top 10 EV Battery Manufacturers in 2023