Markets
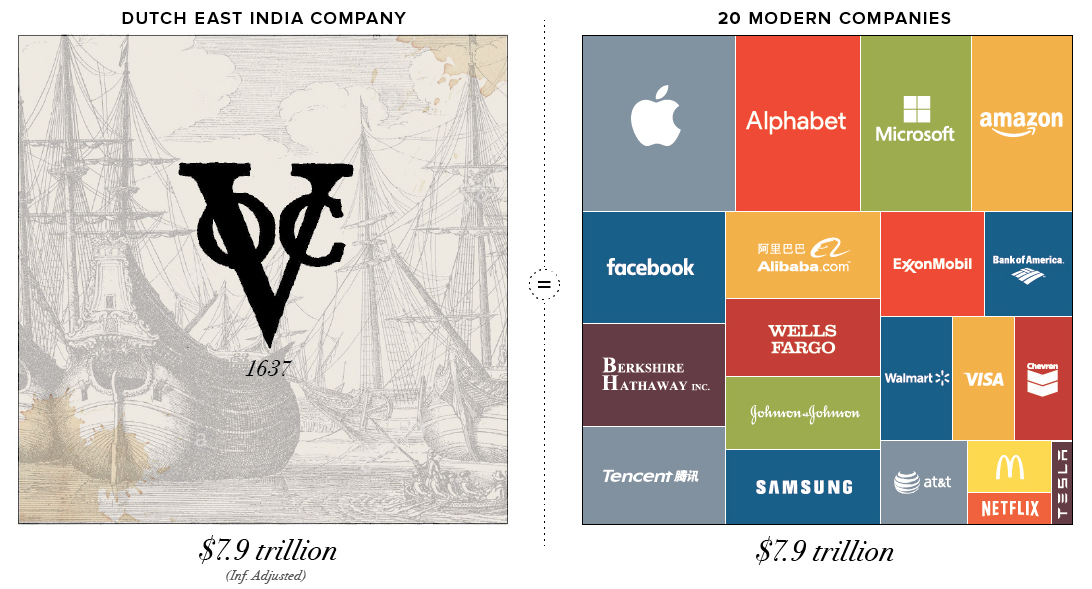
The Most Valuable Companies of All-Time
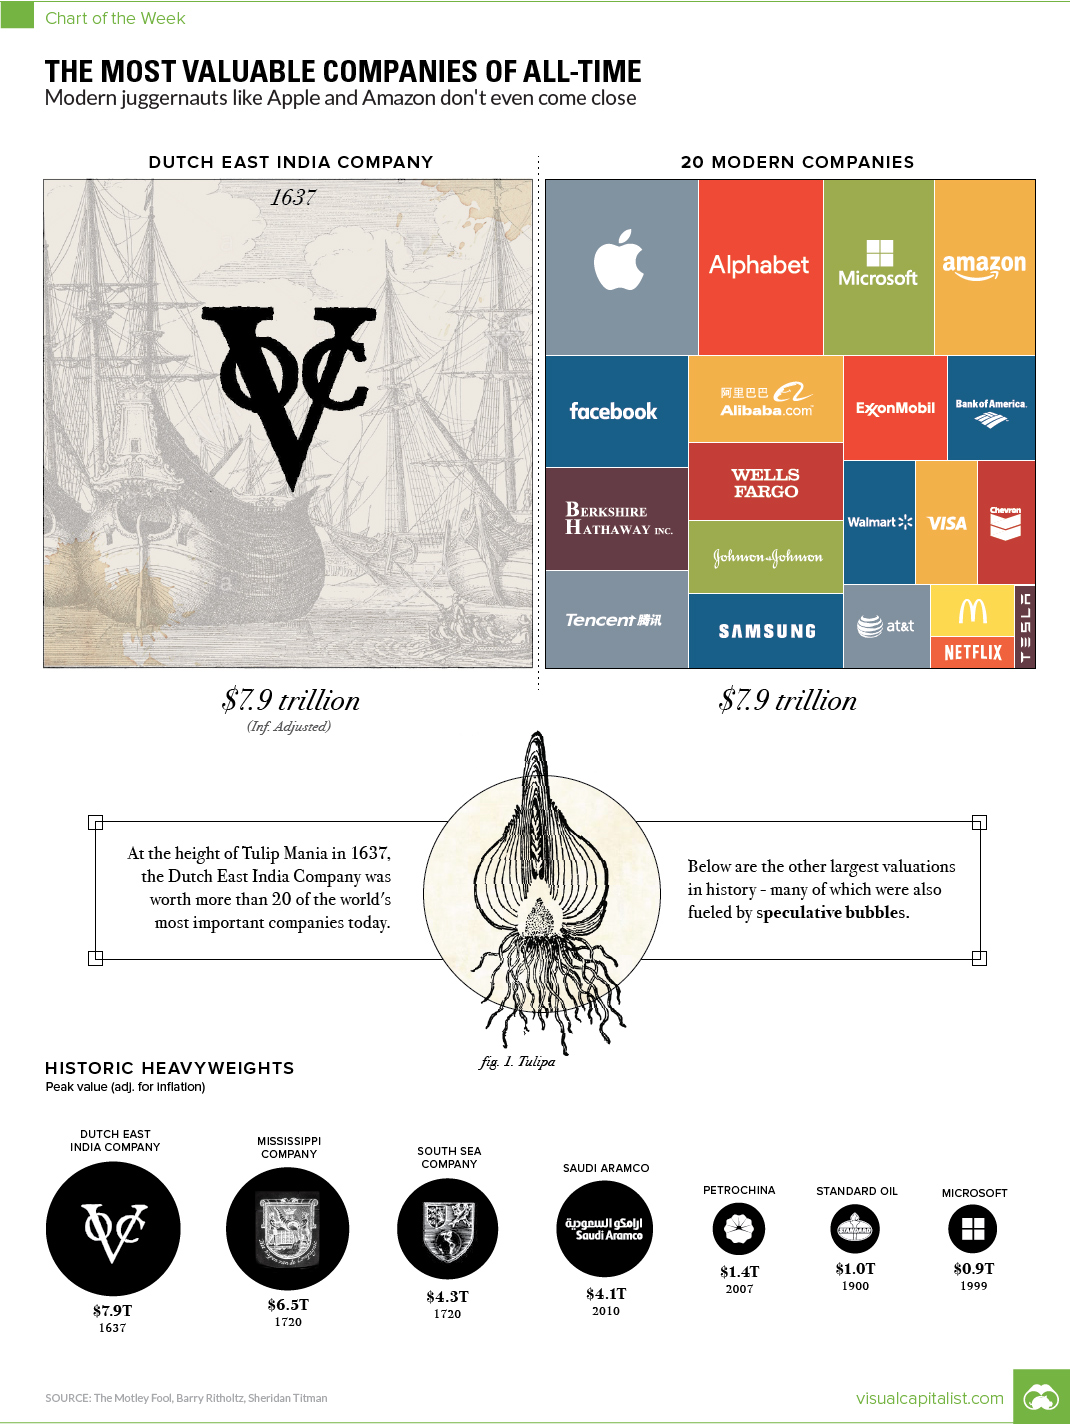
Chart: The Most Valuable Companies of All-Time
The Chart of the Week is a weekly Visual Capitalist feature on Fridays.
Before speculative bubbles could form around Dotcom companies (late-1990s) or housing prices (mid-2000s), some of the first financial bubbles formed from the prospect of trading with faraway lands.
Looking back, it’s pretty easy to see why.
Companies like the Dutch East India Company (known in Dutch as the VOC, or Verenigde Oost-Indische Compagnie) were granted monopolies on trade, and they engaged in daring voyages to mysterious and foreign places. They could acquire exotic goods, establish colonies, create military forces, and even initiate wars or conflicts around the world.
Of course, the very nature of these risky ventures made getting any accurate indication of intrinsic value nearly impossible, which meant there were no real benchmarks for what companies like this should be worth.
Speculative Peak
The Dutch East India Company was established as a charter company in 1602, when it was granted a 21-year monopoly by the Dutch government for the spice trade in Asia. The company would eventually send over one million voyagers to Asia, which is more than the rest of Europe combined.
However, despite its 200-year run as Europe’s foremost trading juggernaut – the speculative peak of the company’s prospects coincided with Tulip Mania in Holland in 1637.
Widely considered the world’s first financial bubble, the history of Tulip Mania is a fantastic story in itself. During this frothy time, the Dutch East India Company was worth 78 million Dutch guilders, which translates to a whopping $7.9 trillion in modern dollars.
This is according to sources such as Alex Planes from The Motley Fool, who has conducted extensive research on the history of very large companies in history.
Modern Comparisons
The peak value of the Dutch East India Company was so high, that it puts modern economies to shame.
In fact, at its height, the Dutch East India Company was worth roughly the same amount as the GDPs of modern-day Japan ($4.8T) and Germany ($3.4T) added together.
Even further, in today’s chart, we added the market caps of 20 of the world’s largest companies, such as Apple, Microsoft, Amazon, ExxonMobil, Berkshire Hathaway, Tencent, and Wells Fargo. All of them combined gets us to $7.9 trillion.
At the same time, the world’s most valuable company (Apple) only makes it to 11% of the peak value of the Dutch East India Company by itself.
Historic Heavyweights
Despite the speculation that fueled the run-up of Dutch East India Company shares, the company was still successful in real terms. At one point, it even had 70,000 employees – a massive accomplishment for a company born over 400 years ago.
The same thing can’t be said for the other two most valuable companies in history – both of which were the subject of simultaneous bubbles occurring in France and Britain that popped in 1720.
In France, the wealth of Louisiana was exaggerated in a marketing scheme for the newly formed Mississippi Company, and its value temporarily soared to the equivalent of $6.5 trillion today. Meanwhile, a joint-stock company in Britain, known as the South Sea Company, was granted a monopoly to trade with South America. It was eventually worth $4.3 trillion in modern currency.
Interestingly, both would barely engage in any actual trade with the Americas.
The other historic heavyweights included in our chart?
- Saudi Aramco, at $4.1 trillion, based on calculations by University of Texas finance professor Sheridan Titman in 2010, and adjusted for inflation.
- PetroChina surpassed $1 trillion in market cap in 2007. Adjusted for inflation that’s $1.4 trillion today.
- Standard Oil, before its famous breakup due to monopolistic reasons, was worth at least $1 trillion. Adjusted for inflation it would likely be more, but we kept this conservative.
- Microsoft reached its peak valuation in 1999, at the top of the Dotcom Bubble. Today, that would be equal to $912 billion.


Markets
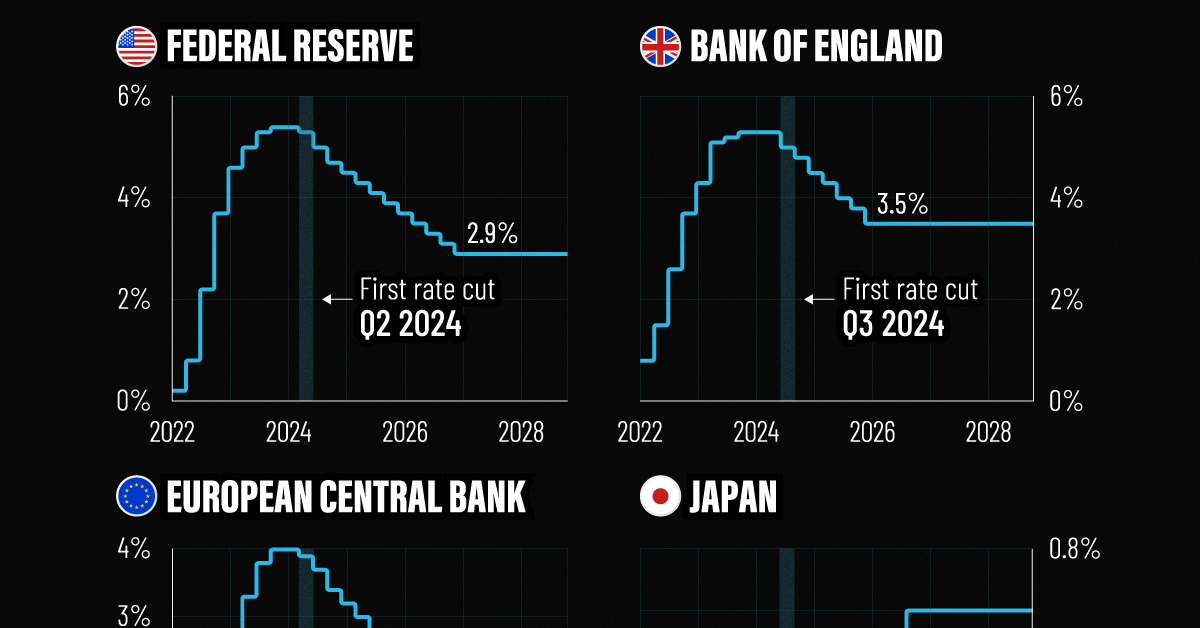
Visualized: Interest Rate Forecasts for Advanced Economies
In this graphic, we show the IMF’s interest rate forecast for the U.S., Europe, the UK, and Japan for the next five years ahead.
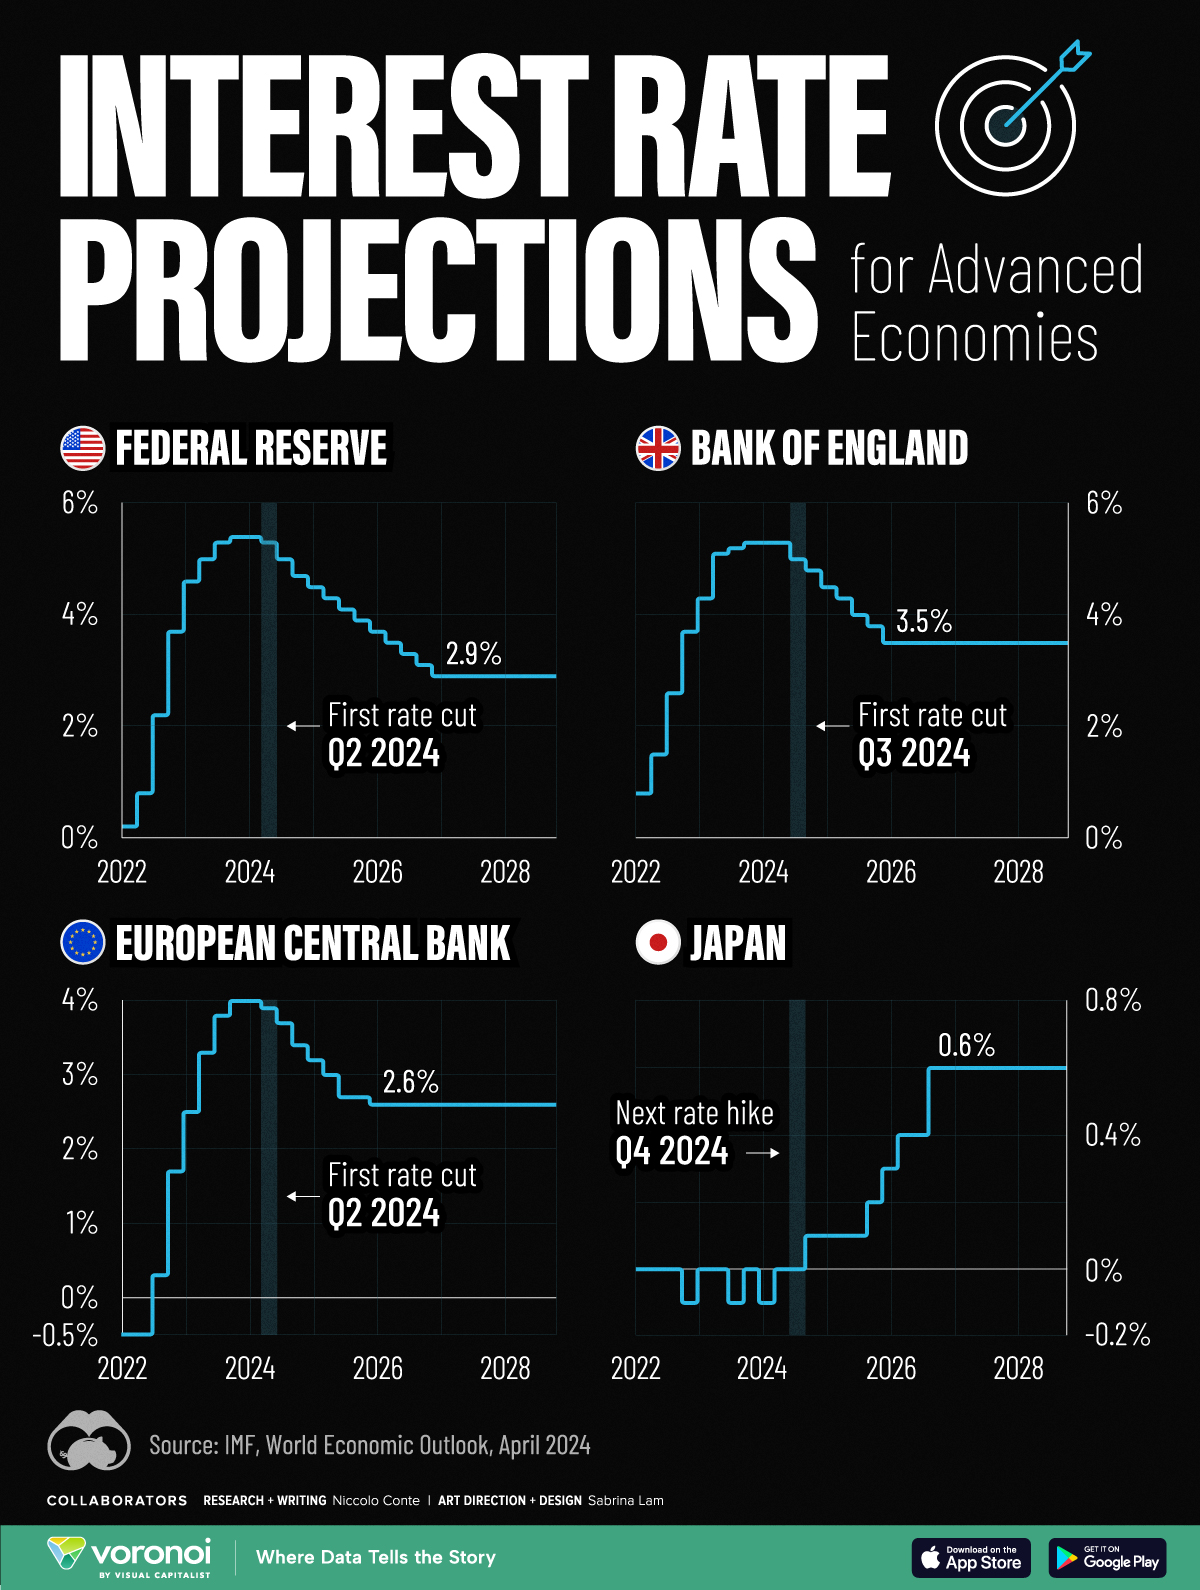
Interest Rate Projections for Advanced Economies
While U.S. inflation cooled in the second half of last year, price pressures returned in 2024, leading investors to rethink how soon central bankers will cut rates.
Despite the recent increase, the interest rate forecast for many economies looks optimistic, thanks to subdued energy price shocks and abating supply chain disruptions. Still, short-term risks remain, including persistently high services inflation clouding the outlook.
This graphic shows the interest rate forecast for advanced economies, based on the International Monetary Fund’s (IMF) 2024 World Economic Outlook.
Get the Key Insights of the IMF’s World Economic Outlook
Want a visual breakdown of the insights from the IMF’s 2024 World Economic Outlook report?
This visual is part of a special dispatch of the key takeaways exclusively for VC+ members.
Get the full dispatch of charts by signing up to VC+.
A Closer Look at the IMF Interest Rate Forecast
Below, we show the projected path of interest rates based on the IMF’s latest data:
| Federal Reserve | Bank of England | ECB | Bank of Japan | |
|---|---|---|---|---|
| Q1 2024 | 5.4% | 4.0% | -0.1% | 5.3% |
| Q2 2024 | 5.3% | 3.9% | 0.0% | 5.3% |
| Q3 2024 | 5.0% | 3.7% | 0.0% | 5.0% |
| Q4 2024 | 4.7% | 3.4% | 0.1% | 4.8% |
| Q1 2025 | 4.5% | 3.2% | 0.1% | 4.5% |
| Q2 2025 | 4.3% | 3.0% | 0.1% | 4.3% |
| Q3 2025 | 4.1% | 2.7% | 0.1% | 4.0% |
| Q4 2025 | 3.9% | 2.7% | 0.2% | 3.8% |
| Q1 2026 | 3.7% | 2.6% | 0.3% | 3.5% |
| Q2 2026 | 3.5% | 2.6% | 0.4% | 3.5% |
| Q3 2026 | 3.3% | 2.6% | 0.4% | 3.5% |
| Q4 2026 | 3.1% | 2.6% | 0.6% | 3.5% |
| Q1 2027 | 2.9% | 2.6% | 0.6% | 3.5% |
| Q2 2027 | 2.9% | 2.6% | 0.6% | 3.5% |
| Q3 2027 | 2.9% | 2.6% | 0.6% | 3.5% |
| Q4 2027 | 2.9% | 2.6% | 0.6% | 3.5% |
| Q1 2028 | 2.9% | 2.6% | 0.6% | 3.5% |
| Q2 2028 | 2.9% | 2.6% | 0.6% | 3.5% |
| Q3 2028 | 2.9% | 2.6% | 0.6% | 3.5% |
| Q4 2028 | 2.9% | 2.6% | 0.6% | 3.5% |
As we can see, the U.S. is forecast to see its first rate cut in the second quarter of 2024.
Broadly speaking, rates will be cut very gradually, with two additional rate cuts anticipated for this year. By 2027, interest rates are projected to fall to 2.9% after a series of moderate rate cuts as inflation dissipates.
Like the U.S., the European Central Bank is forecast to cut rates in the second quarter of 2024, with rates set to fall to 2.6% by 2026. While inflation has cooled at a faster rate across Europe compared to the U.S., GDP growth is also projected to be more muted. This year, the IMF projects that GDP across the euro area will increase just 0.8% versus 2.7% for the U.S. economy.
In the UK, monetary easing is projected to move more gradually, with the first cut projected for the third quarter of this year. Growth across the UK economy is projected to be tepid for 2024, weighed down by the impact of higher rates, lower productivity, and sluggish investment growth.
Rates Rising Slowly in Japan
After years of enduring negative interest rates, Japan raised its short-term policy rate to 0.0-0.1% in March 2024.
This was due in part to a promising inflation outlook over the coming years. The IMF projects that the next rate hike will take place in the fourth quarter of 2024, as it moves away from a multi-decade battle with deflation.
Get the Full Analysis of the IMF’s Outlook on VC+
This visual is part of an exclusive special dispatch for VC+ members which breaks down the key takeaways from the IMF’s 2024 World Economic Outlook.
For the full set of charts and analysis, sign up for VC+.

-

 Wealth6 days ago
Charted: Which City Has the Most Billionaires in 2024?
-

 Mining2 weeks ago
Gold vs. S&P 500: Which Has Grown More Over Five Years?
-

 Uranium2 weeks ago
The World’s Biggest Nuclear Energy Producers
-

 Education2 weeks ago
How Hard Is It to Get Into an Ivy League School?
-

 Debt2 weeks ago
How Debt-to-GDP Ratios Have Changed Since 2000
-

 Sports2 weeks ago
The Highest Earning Athletes in Seven Professional Sports
-

 Science2 weeks ago
Visualizing the Average Lifespans of Mammals
-

 Brands1 week ago
How Tech Logos Have Evolved Over Time