Markets
Japan Officially Gets Leapfrogged by the Four Asian Tigers
Japan Officially Gets Leapfrogged by the Four Asian Tigers
Throughout the decades in the 1950s and 1960s, the Japanese economy was envied for its unrelenting growth.
Dubbed the “Post-War Miracle”, this period of time saw Japan become a global center of manufacturing and exports. Japanese brands such as Toyota, Sony, Honda, Mitsubishi, Panasonic, and Canon would become household names worldwide. By the 1960s, Japan catapulted to become the second largest economy in the world.
Today, Japan has the third largest economy in terms of total nominal GDP, and the fourth largest by GDP adjusted for Purchasing Power Parity (PPP). This doesn’t seem so bad on paper, but Japan also has nearly 130 million people.
What do those amounts look like per capita? It turns out to be not so good.
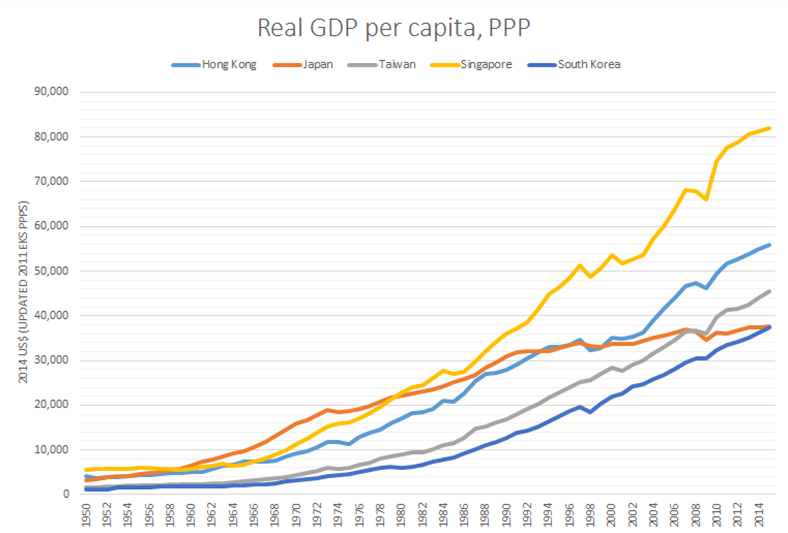
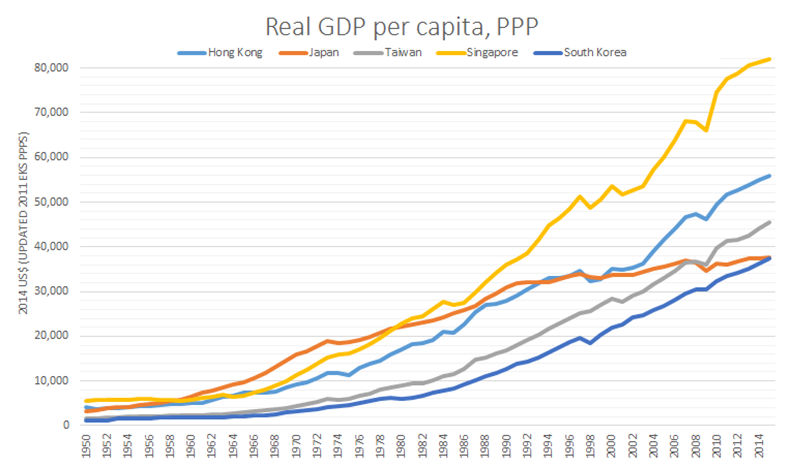
After over two decades of economic stagnation, the most recent GDP per capita (PPP) numbers for 2014 by the IMF had the Japanese economy in 29th place globally. As you saw in the opening chart, even more recent projections from another source show that all four Asian Tigers have now all officially leapfrogged Japan in terms of GDP per capita (PPP).
The “Four Asian Tigers”, a term used to reference the highly free-market and developed economies of Hong Kong, Singapore, South Korea, and Taiwan, have continued to grow despite Japan’s struggles. Singapore, a significant Asian banking center, passed Japan in GDP per capita (PPP) back in 1979. Hong Kong would be the next to do so in 1993, and Taiwan would jump ahead during the Financial Crisis. The last of the leapfrogging happened when South Korea passed Japan this year.
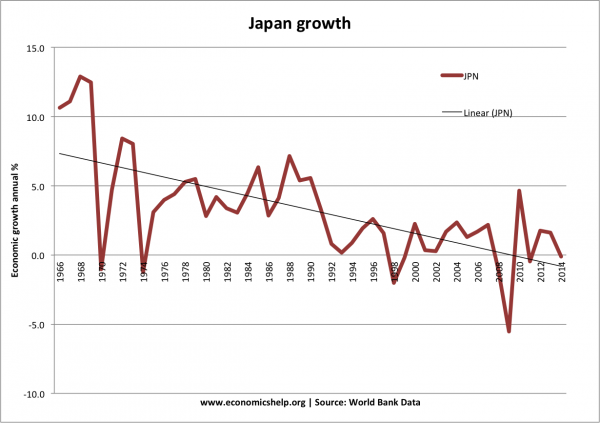
This shouldn’t be too surprising, as the struggles of Japan over the last 25 years have been well-documented. However, a point of interest may be the context of how these challenges began.
In the mid-80s, the yen had basically doubled in value against the dollar. For a manufacturing and exporting nation (similar to how China is today), this was less than ideal. While this was happening, the Bank of Japan intervened with five sessions of monetary easing starting in January 1986 to weaken the yen, cutting interest rates from 5.0% to 2.5% in just one year.
During this time, monetary growth was much quicker than anticipated. More-than-sufficient liquidity and ultra low interest rates fueled speculation, which helped lead to inflate a classic asset bubble. In the early 90s, the BOJ hiked rates to counter speculation and curb inflation.
The asset bubble popped, and Japan’s economy would be sent into the “Lost Decade” – a “decade” which has lasted 25 years.
You can see the drastic increase in money supply leading up to the crisis here:
Japan now has the world’s highest debt-to-GDP ratio of 243% as well as the world’s highest debt-to-revenue ratio.
Despite this, they’ve started an even more potentially dangerous experiment known as Abenomics, which is the three-headed beast of unprecedented quantitative easing, monetary stimulus, and reforms.
Original graphics by: Utopia – You’re Standing In It (blog), Trading Economics


Markets
Visualizing Global Inflation Forecasts (2024-2026)
Here are IMF forecasts for global inflation rates up to 2026, highlighting a slow descent of price pressures amid resilient global growth.


Visualizing Global Inflation Forecasts (2024-2026)
Global inflation rates are gradually descending, but progress has been slow.
Today, the big question is if inflation will decline far enough to trigger easing monetary policy. So far, the Federal Reserve has held rates for nine months amid stronger than expected core inflation, which excludes volatile energy and food prices.
Yet looking further ahead, inflation forecasts from the International Monetary Fund (IMF) suggest that inflation will decline as price pressures ease, but the path of disinflation is not without its unknown risks.
This graphic shows global inflation forecasts, based on data from the April 2024 IMF World Economic Outlook.
Get the Key Insights of the IMF’s World Economic Outlook
Want a visual breakdown of the insights from the IMF’s 2024 World Economic Outlook report?
This visual is part of a special dispatch of the key takeaways exclusively for VC+ members.
Get the full dispatch of charts by signing up to VC+.
The IMF’s Inflation Outlook
Below, we show the IMF’s latest projections for global inflation rates through to 2026:
| Year | Global Inflation Rate (%) | Advanced Economies Inflation Rate (%) | Emerging Market and Developing Economies Inflation Rate (%) |
|---|---|---|---|
| 2019 | 3.5 | 1.4 | 5.1 |
| 2020 | 3.2 | 0.7 | 5.2 |
| 2021 | 4.7 | 3.1 | 5.9 |
| 2022 | 8.7 | 7.3 | 9.8 |
| 2023 | 6.8 | 4.6 | 8.3 |
| 2024 | 5.9 | 2.6 | 8.3 |
| 2025 | 4.5 | 2.0 | 6.2 |
| 2026 | 3.7 | 2.0 | 4.9 |
After hitting a peak of 8.7% in 2022, global inflation is projected to fall to 5.9% in 2024, reflecting promising inflation trends amid resilient global growth.
While inflation has largely declined due to falling energy and goods prices, persistently high services inflation poses challenges to mitigating price pressures. In addition, the IMF highlights the potential risk of an escalating conflict in the Middle East, which could lead to energy price shocks and higher shipping costs.
These developments could negatively affect inflation scenarios and prompt central banks to adopt tighter monetary policies. Overall, by 2026, global inflation is anticipated to decline to 3.7%—still notably above the 2% target set by several major economies.
Adding to this, we can see divergences in the path of inflation between advanced and emerging economies. While affluent nations are forecast to see inflation edge closer to the 2% target by 2026, emerging economies are projected to have inflation rates reach 4.9%—falling closer to their pre-pandemic averages.
Get the Full Analysis of the IMF’s Outlook on VC+
This visual is part of an exclusive special dispatch for VC+ members which breaks down the key takeaways from the IMF’s 2024 World Economic Outlook.
For the full set of charts and analysis, sign up for VC+.

-

 Money6 days ago
Charted: Which Country Has the Most Billionaires in 2024?
-

 Energy2 weeks ago
Ranked: The Top 10 EV Battery Manufacturers in 2023
-

 Demographics2 weeks ago
Countries With the Largest Happiness Gains Since 2010
-

 VC+2 weeks ago
VC+: Get Our Key Takeaways From the IMF’s World Economic Outlook
-

 Demographics2 weeks ago
The Countries That Have Become Sadder Since 2010
-

 Money2 weeks ago
Charted: Who Has Savings in This Economy?
-

 Technology1 week ago
Visualizing AI Patents by Country
-

 Economy1 week ago
Economic Growth Forecasts for G7 and BRICS Countries in 2024