Energy
How Big Are Canada’s Oil Sands?

Infographic: How Big Are Canada’s Oil Sands?
There’s no shortage of discussion on Canada’s oil sands. Even Leonardo Dicaprio has recently toured them while subsequently providing commentary that ruffled the feathers of the province of Alberta.
All conversation aside, our team at Visual Capitalist was curious to see how big they actually were. In this infographic, we look at their overall size as well as what portions can be recovered by mining or “in situ” methods.
As a whole, the oil sands are about as big as the state of Florida. The mineable portion makes up about 3% of that total, which is for bitumen deposits less than 75 metres below ground. For perspective, this is about 6x the size of New York City. Meanwhile, the rest (about 97%) must be recovered by “in situ” methods such as SAGD where heavy oil is pumped to the surface.
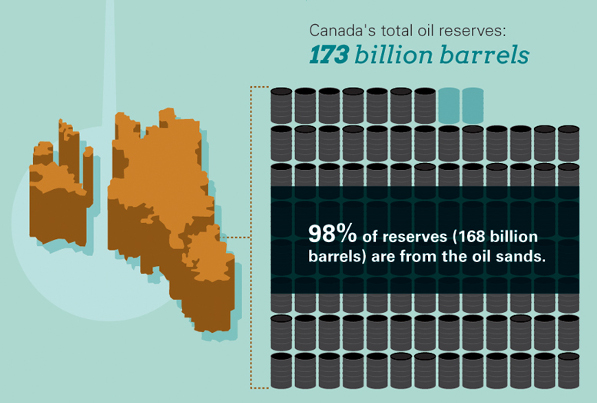
Surely something with this size and scope must have a big impact in other places – and it does. The oil sands produce more than 56% of Canada’s oil and contains over 98% of Canada’s proven reserves. Over the next 25 years, $783 billion in royalties and taxes will be paid to the government.
This is not without significant costs, as greenhouse gas emission numbers are also staggering. Between 1990 and 2011, emissions from the oil sands have increased 267%. Now, Alberta produces 69 tonnes of GHG emissions per person. If it were a country, the province would have 3x the emissions as the USA or Canada per capita. Also, tailings ponds make up 176 sq. km of Northern Alberta, which is roughly the size of two Manhattans.


Who’s Building the Most Solar Energy?
This was originally posted on our Voronoi app. Download the app for free on iOS or Android and discover incredible data-driven charts from a variety of trusted sources.
In 2023, solar energy accounted for three-quarters of renewable capacity additions worldwide. Most of this growth occurred in Asia, the EU, and the U.S., continuing a trend observed over the past decade.
In this graphic, we illustrate the rise in installed solar photovoltaic (PV) capacity in China, the EU, and the U.S. between 2010 and 2022, measured in gigawatts (GW). Bruegel compiled the data..
Chinese Dominance
As of 2022, China’s total installed capacity stands at 393 GW, nearly double that of the EU’s 205 GW and surpassing the USA’s total of 113 GW by more than threefold in absolute terms.
| Installed solar capacity (GW) | China | EU27 | U.S. |
|---|---|---|---|
| 2022 | 393.0 | 205.5 | 113.0 |
| 2021 | 307.0 | 162.7 | 95.4 |
| 2020 | 254.0 | 136.9 | 76.4 |
| 2019 | 205.0 | 120.1 | 61.6 |
| 2018 | 175.3 | 104.0 | 52.0 |
| 2017 | 130.8 | 96.2 | 43.8 |
| 2016 | 77.8 | 91.5 | 35.4 |
| 2015 | 43.6 | 87.7 | 24.2 |
| 2014 | 28.4 | 83.6 | 18.1 |
| 2013 | 17.8 | 79.7 | 13.3 |
| 2012 | 6.7 | 71.1 | 8.6 |
| 2011 | 3.1 | 53.3 | 5.6 |
| 2010 | 1.0 | 30.6 | 3.4 |
Since 2017, China has shown a compound annual growth rate (CAGR) of approximately 25% in installed PV capacity, while the USA has seen a CAGR of 21%, and the EU of 16%.
Additionally, China dominates the production of solar power components, currently controlling around 80% of the world’s solar panel supply chain.
In 2022, China’s solar industry employed 2.76 million individuals, with manufacturing roles representing approximately 1.8 million and the remaining 918,000 jobs in construction, installation, and operations and maintenance.
The EU industry employed 648,000 individuals, while the U.S. reached 264,000 jobs.
According to the IEA, China accounts for almost 60% of new renewable capacity expected to become operational globally by 2028.
Despite the phasing out of national subsidies in 2020 and 2021, deployment of solar PV in China is accelerating. The country is expected to reach its national 2030 target for wind and solar PV installations in 2024, six years ahead of schedule.

-

 Markets5 days ago
The World’s Fastest Growing Emerging Markets (2024-2029 Forecast)
-

 Technology2 weeks ago
All of the Grants Given by the U.S. CHIPS Act
-

 Green2 weeks ago
The Carbon Footprint of Major Travel Methods
-

 United States2 weeks ago
Visualizing the Most Common Pets in the U.S.
-

 Culture2 weeks ago
The World’s Top Media Franchises by All-Time Revenue
-

 Visual Capitalist1 week ago
Best Visualizations of April on the Voronoi App
-

 Wealth1 week ago
Charted: Which Country Has the Most Billionaires in 2024?
-

 Markets1 week ago
The Top Private Equity Firms by Country