Markets
Great Lakes Economy: Examining the Cross-Border Supply Chain
If the region surrounding the Great Lakes was its own country, it would be the 3rd largest economy in the world with a GDP of $6 trillion. That’s bigger than Japan or Germany, and certainly a force on the global stage.
However, this highly-integrated Great Lakes economic engine is different than many others – that’s because it has an international border right down the middle of it. The area’s five massive freshwater lakes are actually nestled right between eight U.S. states and two Canadian provinces, making frictionless trade a necessity to stay competitive in global markets.
How This Supply Chain Works
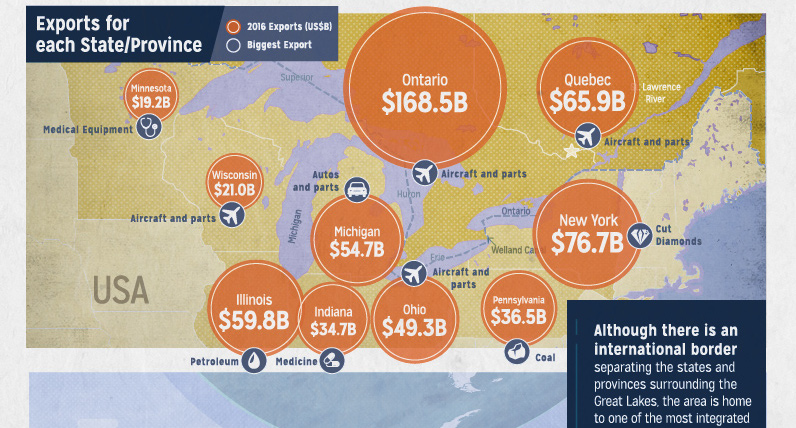
Today’s infographic comes to us from the Council of the Great Lakes Region, and it details the integration of the cross-border supply chain that helps the region make goods that are competitive in international markets.

In today’s extremely competitive and borderless global economy, many goods that get produced are ultimately the result of a group effort.
Both large and small companies rely heavily on highly specialized suppliers from all parts of the globe to get what they need to build the best product. Luckily, in the Great Lakes economy, one does not have to go far to find goods or services to fill these gaps.
Goods of the Great Lakes
1. Manufacturing
Both the automotive and aerospace industries are incredibly important to the United States and Canada – and within the Great Lakes region, these industries are highly integrated to compete on a global level.
In the auto sector, supply chains rely on parts to come from multiple companies in both the U.S. and Canada. In some cases, automobiles may contain components that have crossed the border up to 18 times before the finished product reaches the final car lot.
The aerospace supply chains between the United States and Canada are also highly interdependent. In 2016, for example, Canada was the fifth largest foreign market for U.S. aerospace exports, valued at approximately $8.3 billion. Meanwhile, the United States is also Canada’s largest aerospace market, receiving 60% of all Canadian aerospace exports.
2. Mining and Energy
Manufacturers in the Great Lakes don’t have to look far for the raw materials needed to manufacture autos and airplanes. These can be found nearby, along with other key metals and minerals.
Some key examples? Pennsylvania produces important met coal, which is used to produce steel, while Minnesota is the largest producer of iron ore in the United States. North of the border, Quebec’s aluminum is becoming more important for auto and aerospace producers in both Michigan and Ontario. As a whole, the Great Lakes region produces billions of dollars worth of minerals every year.
Although the Great Lake states are not known for their crude oil production, they are home to three of the country’s 10 largest refineries. Processing oil from the U.S., Canada, and other international sources, these refineries make sure fuel is abundantly close for Great Lakes industry.
3. Food and Agriculture
While goods vary greatly from place to place, the food industry is also very interconnected in the Great Lakes. For example, Pennsylvania benefits from selling chocolate products to Canada, while Minnesota and Ohio both sell animal feed.
Every year, Great Lake states ship $8.4 billion of exports to Canada, receiving $8.9 billion of imports in return.


Markets
The European Stock Market: Attractive Valuations Offer Opportunities
On average, the European stock market has valuations that are nearly 50% lower than U.S. valuations. But how can you access the market?


European Stock Market: Attractive Valuations Offer Opportunities
Europe is known for some established brands, from L’Oréal to Louis Vuitton. However, the European stock market offers additional opportunities that may be lesser known.
The above infographic, sponsored by STOXX, outlines why investors may want to consider European stocks.
Attractive Valuations
Compared to most North American and Asian markets, European stocks offer lower or comparable valuations.
| Index | Price-to-Earnings Ratio | Price-to-Book Ratio |
|---|---|---|
| EURO STOXX 50 | 14.9 | 2.2 |
| STOXX Europe 600 | 14.4 | 2 |
| U.S. | 25.9 | 4.7 |
| Canada | 16.1 | 1.8 |
| Japan | 15.4 | 1.6 |
| Asia Pacific ex. China | 17.1 | 1.8 |
Data as of February 29, 2024. See graphic for full index names. Ratios based on trailing 12 month financials. The price to earnings ratio excludes companies with negative earnings.
On average, European valuations are nearly 50% lower than U.S. valuations, potentially offering an affordable entry point for investors.
Research also shows that lower price ratios have historically led to higher long-term returns.
Market Movements Not Closely Connected
Over the last decade, the European stock market had low-to-moderate correlation with North American and Asian equities.
The below chart shows correlations from February 2014 to February 2024. A value closer to zero indicates low correlation, while a value of one would indicate that two regions are moving in perfect unison.
| EURO STOXX 50 | STOXX EUROPE 600 | U.S. | Canada | Japan | Asia Pacific ex. China |
|
|---|---|---|---|---|---|---|
| EURO STOXX 50 | 1.00 | 0.97 | 0.55 | 0.67 | 0.24 | 0.43 |
| STOXX EUROPE 600 | 1.00 | 0.56 | 0.71 | 0.28 | 0.48 | |
| U.S. | 1.00 | 0.73 | 0.12 | 0.25 | ||
| Canada | 1.00 | 0.22 | 0.40 | |||
| Japan | 1.00 | 0.88 | ||||
| Asia Pacific ex. China | 1.00 |
Data is based on daily USD returns.
European equities had relatively independent market movements from North American and Asian markets. One contributing factor could be the differing sector weights in each market. For instance, technology makes up a quarter of the U.S. market, but health care and industrials dominate the broader European market.
Ultimately, European equities can enhance portfolio diversification and have the potential to mitigate risk for investors.
Tracking the Market
For investors interested in European equities, STOXX offers a variety of flagship indices:
| Index | Description | Market Cap |
|---|---|---|
| STOXX Europe 600 | Pan-regional, broad market | €10.5T |
| STOXX Developed Europe | Pan-regional, broad-market | €9.9T |
| STOXX Europe 600 ESG-X | Pan-regional, broad market, sustainability focus | €9.7T |
| STOXX Europe 50 | Pan-regional, blue-chip | €5.1T |
| EURO STOXX 50 | Eurozone, blue-chip | €3.5T |
Data is as of February 29, 2024. Market cap is free float, which represents the shares that are readily available for public trading on stock exchanges.
The EURO STOXX 50 tracks the Eurozone’s biggest and most traded companies. It also underlies one of the world’s largest ranges of ETFs and mutual funds. As of November 2023, there were €27.3 billion in ETFs and €23.5B in mutual fund assets under management tracking the index.
“For the past 25 years, the EURO STOXX 50 has served as an accurate, reliable and tradable representation of the Eurozone equity market.”
— Axel Lomholt, General Manager at STOXX
Partnering with STOXX to Track the European Stock Market
Are you interested in European equities? STOXX can be a valuable partner:
- Comprehensive, liquid and investable ecosystem
- European heritage, global reach
- Highly sophisticated customization capabilities
- Open architecture approach to using data
- Close partnerships with clients
- Part of ISS STOXX and Deutsche Börse Group
With a full suite of indices, STOXX can help you benchmark against the European stock market.
Learn how STOXX’s European indices offer liquid and effective market access.

-

 Economy4 days ago
Economic Growth Forecasts for G7 and BRICS Countries in 2024
The IMF has released its economic growth forecasts for 2024. How do the G7 and BRICS countries compare?
-

 Markets2 weeks ago
U.S. Debt Interest Payments Reach $1 Trillion
U.S. debt interest payments have surged past the $1 trillion dollar mark, amid high interest rates and an ever-expanding debt burden.
-

 United States2 weeks ago
Ranked: The Largest U.S. Corporations by Number of Employees
We visualized the top U.S. companies by employees, revealing the massive scale of retailers like Walmart, Target, and Home Depot.
-

 Markets2 weeks ago
The Top 10 States by Real GDP Growth in 2023
This graphic shows the states with the highest real GDP growth rate in 2023, largely propelled by the oil and gas boom.
-

 Markets3 weeks ago
Ranked: The World’s Top Flight Routes, by Revenue
In this graphic, we show the highest earning flight routes globally as air travel continued to rebound in 2023.
-

 Markets3 weeks ago
Ranked: The Most Valuable Housing Markets in America
The U.S. residential real estate market is worth a staggering $47.5 trillion. Here are the most valuable housing markets in the country.


-

 Lithium6 days ago
Ranked: The Top 10 EV Battery Manufacturers in 2023
-

 Green2 weeks ago
Top Countries By Forest Growth Since 2001
-
United States2 weeks ago
Ranked: The Largest U.S. Corporations by Number of Employees
-

 Maps2 weeks ago
The Largest Earthquakes in the New York Area (1970-2024)
-

 Green2 weeks ago
Ranked: The Countries With the Most Air Pollution in 2023
-

 Green2 weeks ago
Ranking the Top 15 Countries by Carbon Tax Revenue
-
Markets2 weeks ago
U.S. Debt Interest Payments Reach $1 Trillion
-

 Mining2 weeks ago
Gold vs. S&P 500: Which Has Grown More Over Five Years?