Markets
Every Chinese Overseas Investment Over $100M Visualized
Every Chinese Overseas Investment Over $100M Visualized
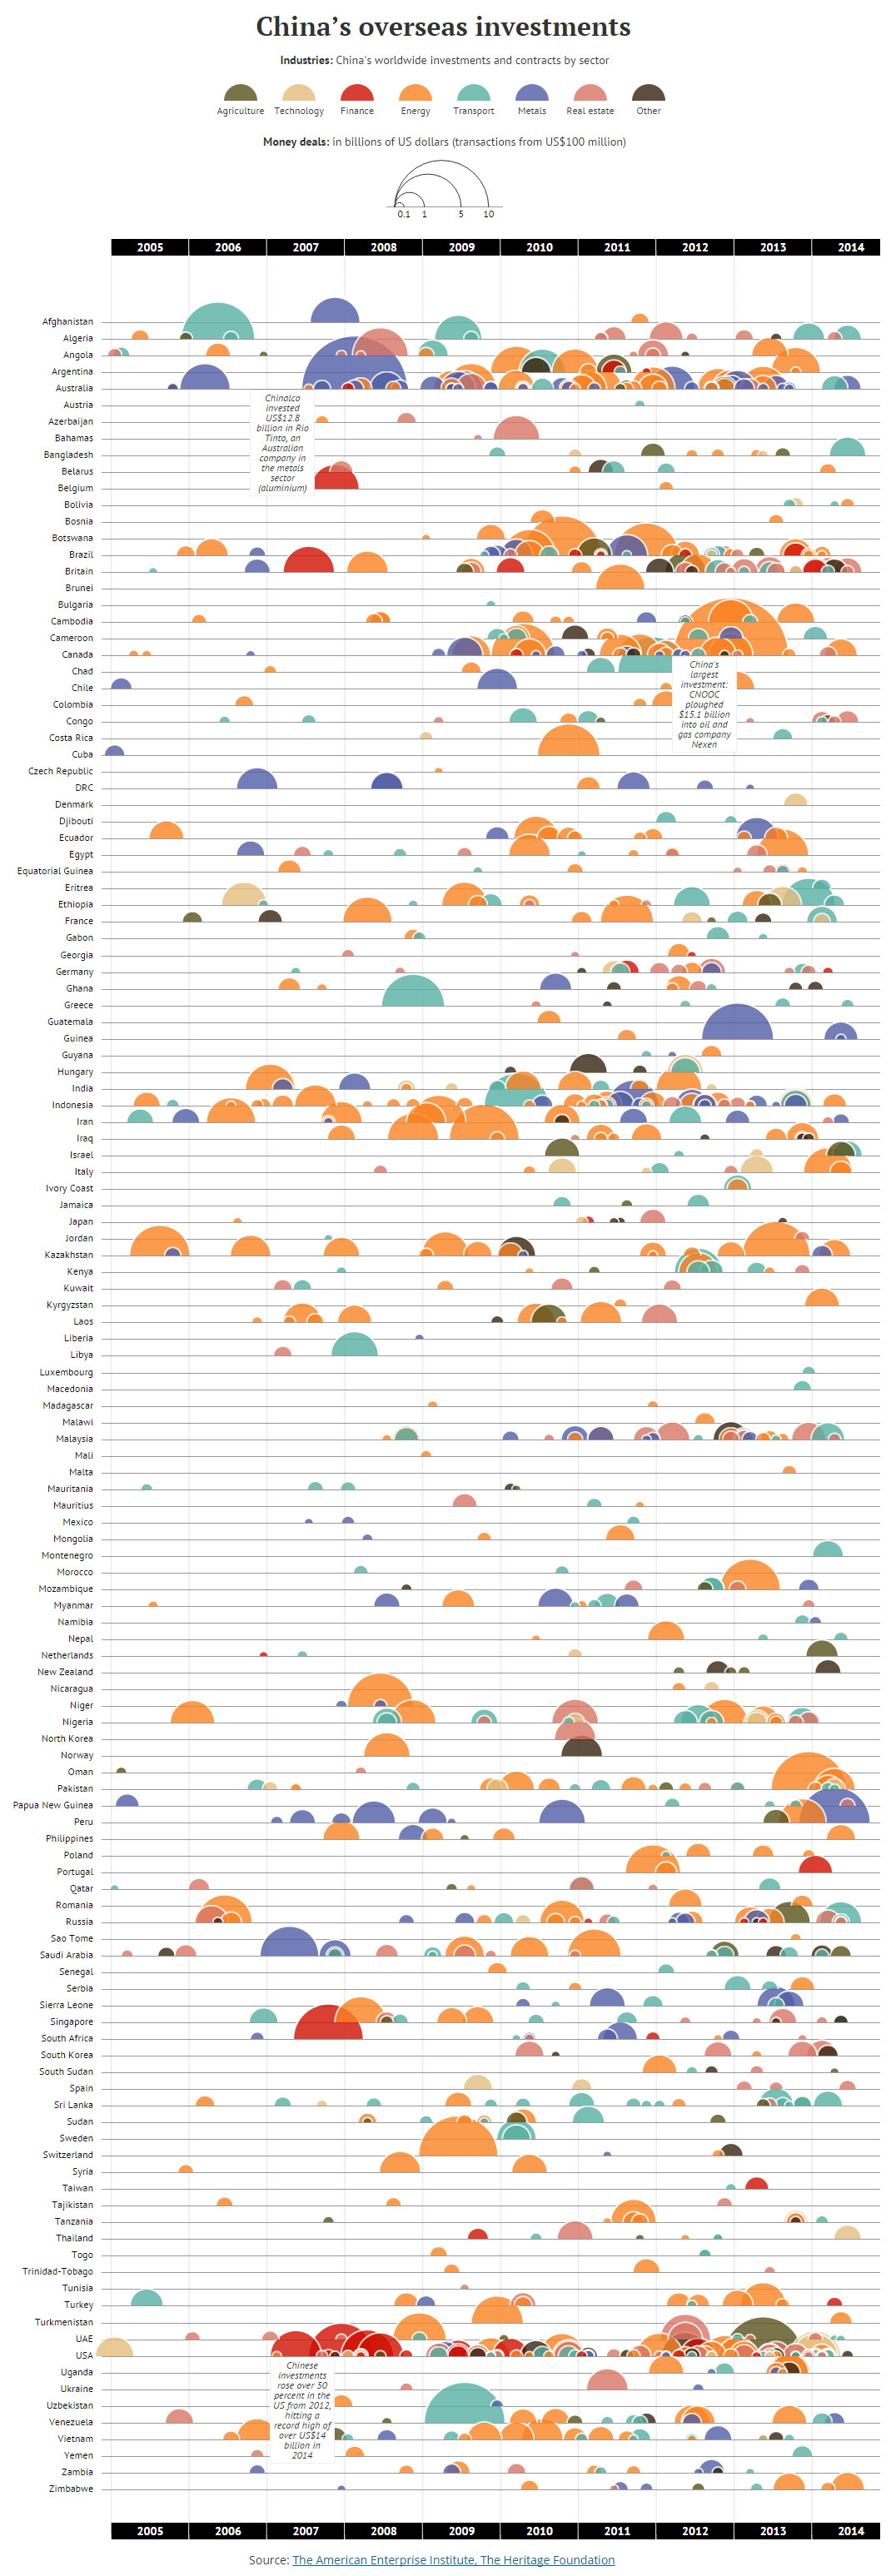
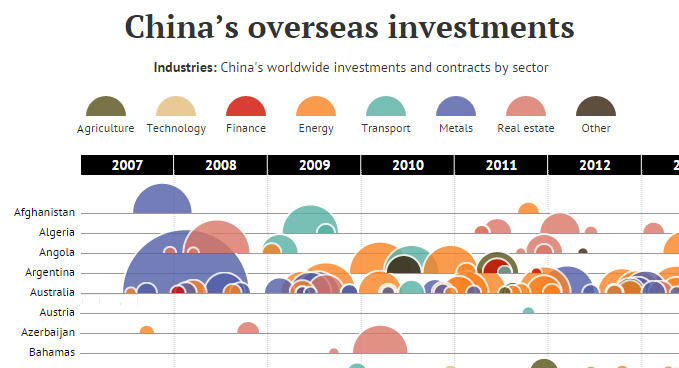
The global reach of the world’s most populous country has grown exponentially over the last decade. China’s thirst for assets in metals, energy, agriculture, and other sectors is reflected in today’s post.
In the above data visualization, every attempted Chinese merger and acquisition (M&A) overseas over $100 million is sorted by country and industry. Showing over 1,250 attempted transactions (excluding bonds), this list includes both successful and failed attempts in order to help visualize the ebb and flow of Chinese investments up until mid-2014.
This fantastic data was compiled and visualized by South China Post, and there is an even better interactive version hosted on their site.
The largest successful transaction was in 2012, when state-owned CNOOC bought Canadian oil and gas giant Nexen for $15.1 billion. With the crash in energy prices, just years later the Chinese parent company is looking at enormous writedowns exceeding $5 billion on its Nexen assets.
Chinalco, the world’s second largest alumina miner, bid for some of Rio Tinto’s assets in 2008 in what would be the second largest M&A transaction on the list, but the deal eventually fell through.
Chinese investments rose over 50% in the United States from 2012, hitting a high of over $14 billion in 2014.


Markets
Mapped: The Most Valuable Company in Each Southeast Asian Country
Six businesses in the broader financial space are present on this list of the largest companies, by market cap, in each Southeast Asian country.
The Most Valuable Company in Each Southeast Asian Country
This was originally posted on our Voronoi app. Download the app for free on iOS or Android and discover incredible data-driven charts from a variety of trusted sources.
Southeast Asia has been emerging as an economic powerhouse in the past decade. However, there are very noticeable disparities in the sizes of the largest publicly-traded corporations in countries within the region.
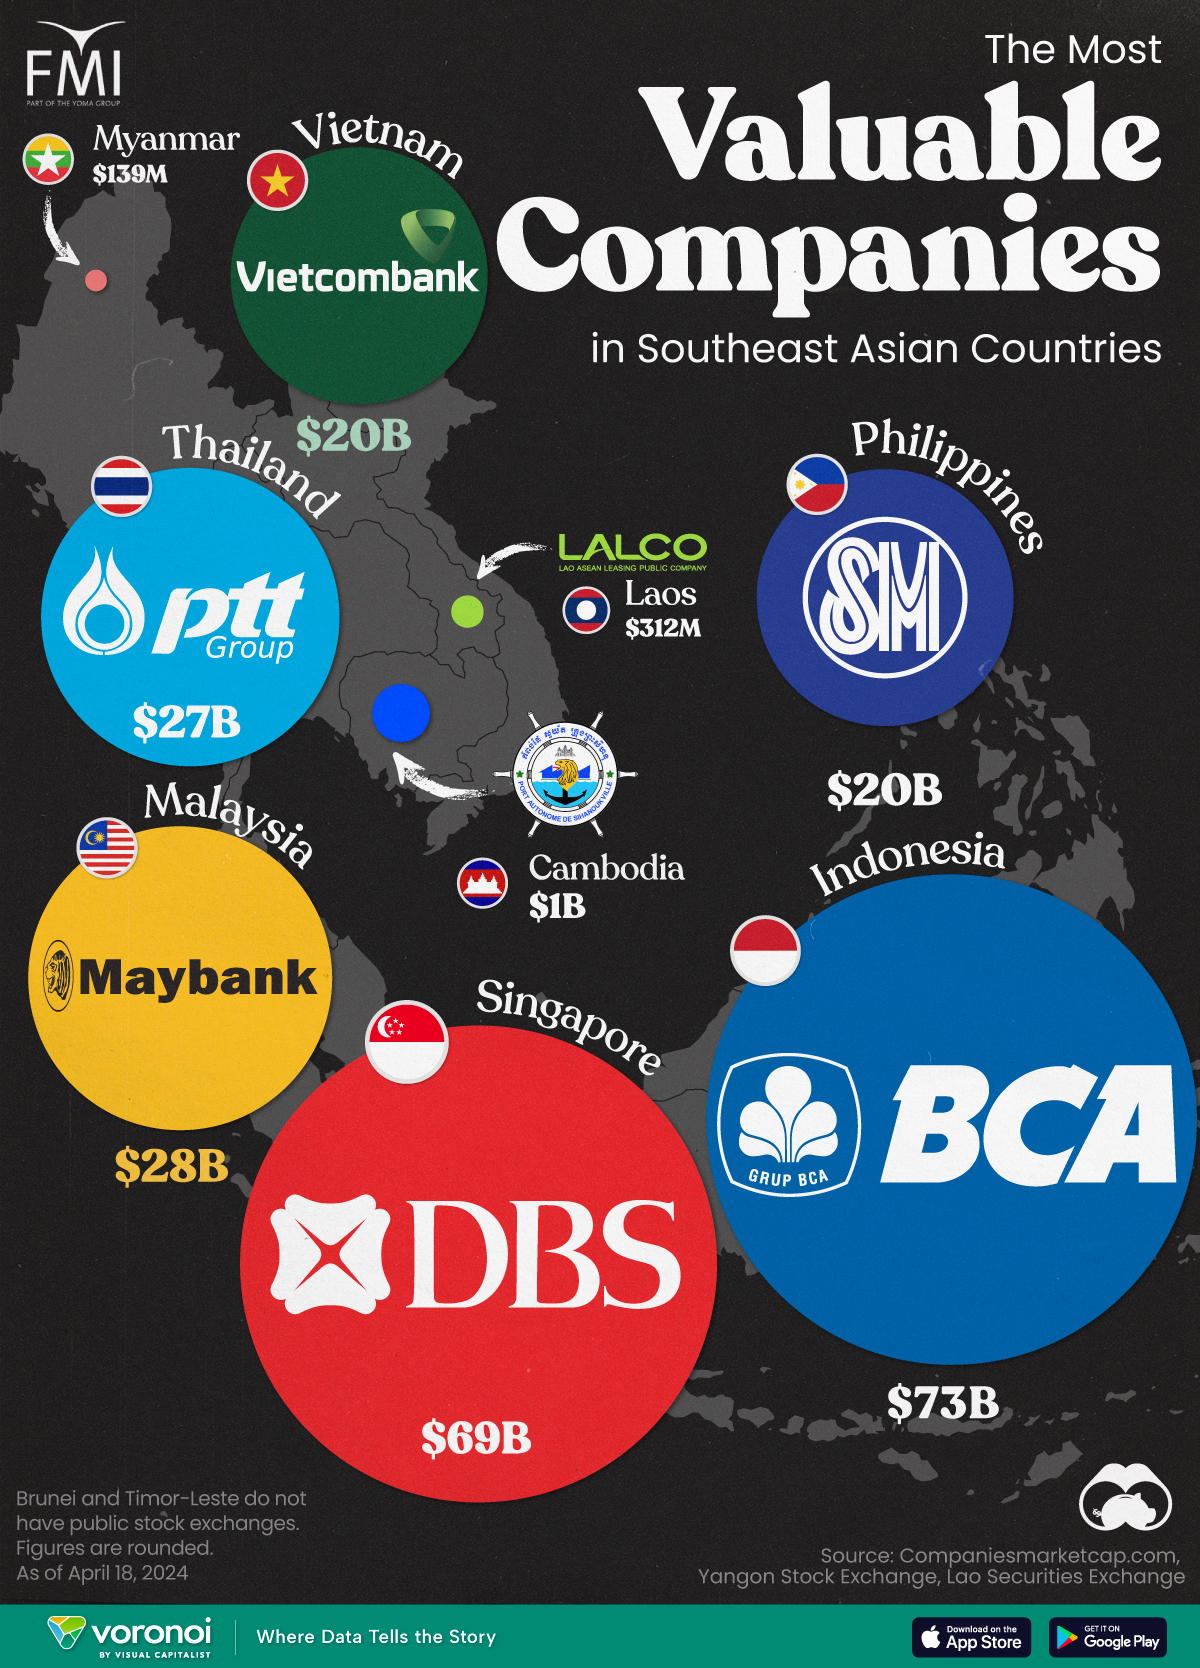
In this visualization, we map the most valuable company in each Southeast Asian country, by their market capitalization in current U.S. dollars as of April 18th, 2024.
Data for this visualization and article is sourced from Companiesmarketcap.com, and the Laos and Yangon stock exchanges.
Southeast Asia’s Biggest Companies are Banks
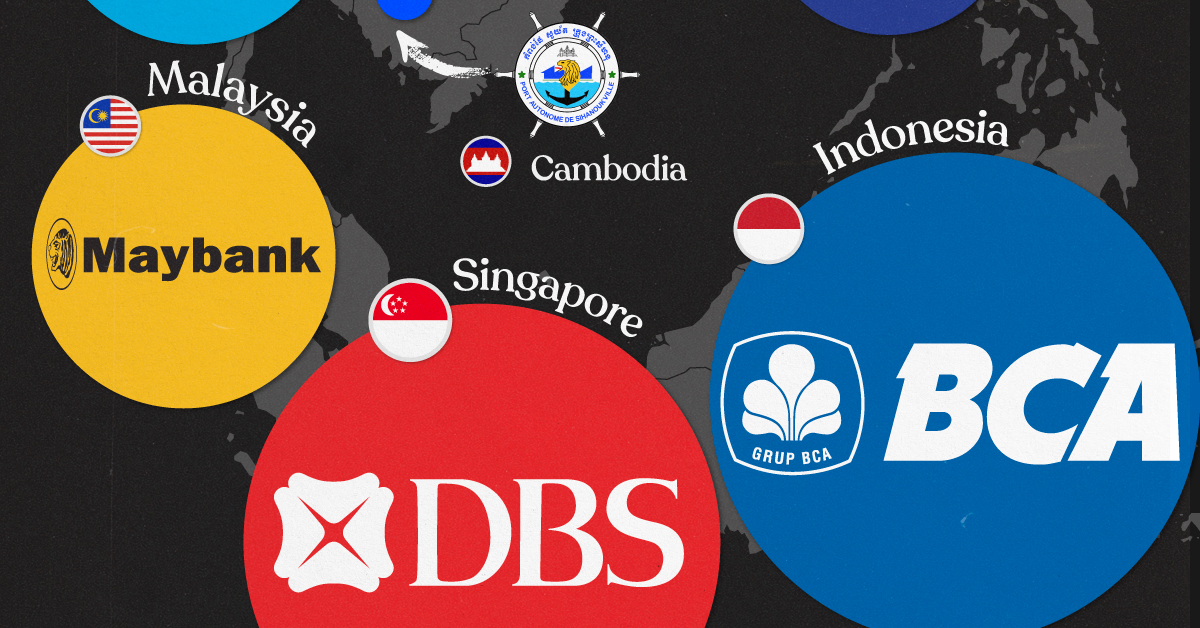
The most valuable companies in Indonesia and Singapore, Bank Central Asia and DBS Group, are each worth more than $60 billion, and both are banks.
In the quartet of Malaysia, Thailand, Vietnam, and the Philippines, the largest companies by market cap are all worth around $20 billion. Out of the four, two are banks.
| Country | Company | Market Cap |
|---|---|---|
| 🇮🇩 Indonesia | 🏦 Bank Central Asia | $73B |
| 🇸🇬 Singapore | 🏦 DBS Group | $69B |
| 🇲🇾 Malaysia | 🏦 Maybank | $28B |
| 🇹🇭 Thailand | ⛽ PTT PCL | $27B |
| 🇻🇳 Vietnam | 🏦 Vietcombank | $20B |
| 🇵🇭 Philippines | 📈 SM Investments Corporation | $20B |
| 🇰🇭 Cambodia | 🚢 Sihanoukville Autonomous Port | $1B |
| 🇱🇦 Laos | 🏭 LALCO | $312M |
| 🇲🇲 Myanmar | 📈 First Myanmar Investment | $139M |
Note: Figures are rounded, and current as of April 18th, 2024.
Cambodia stands by itself, with its most valuable publicly listed company, Sihanoukville Autonomous Port, worth $1 billion.
Meanwhile, LALCO in Laos is a credit leasing company worth $312 million and Myanmar’s biggest company, First Myanmar Investment, is worth $139 million.
Finally, Brunei and Timor-Leste do not have public stock exchanges, but for different reasons.
Most of Brunei’s economy relies on the state-owned oil sector, which also helps make its sultan the world’s second-richest monarch. However, in Timor-Leste, a small population combined with limited access to credit and liquidity has led to limited opportunities for the creation of publicly-listed companies or an exchange.

-

 Economy7 days ago
Ranked: The Top 20 Countries in Debt to China
-

 Demographics2 weeks ago
The Countries That Have Become Sadder Since 2010
-

 Money2 weeks ago
Charted: Who Has Savings in This Economy?
-

 Technology2 weeks ago
Visualizing AI Patents by Country
-

 Markets2 weeks ago
Economic Growth Forecasts for G7 and BRICS Countries in 2024
-

 Wealth2 weeks ago
Charted: Which City Has the Most Billionaires in 2024?
-

 Technology1 week ago
All of the Grants Given by the U.S. CHIPS Act
-

 Green1 week ago
The Carbon Footprint of Major Travel Methods