Technology
The Dominance of Google and Facebook in One Chart
The Dominance of Google and Facebook in One Chart
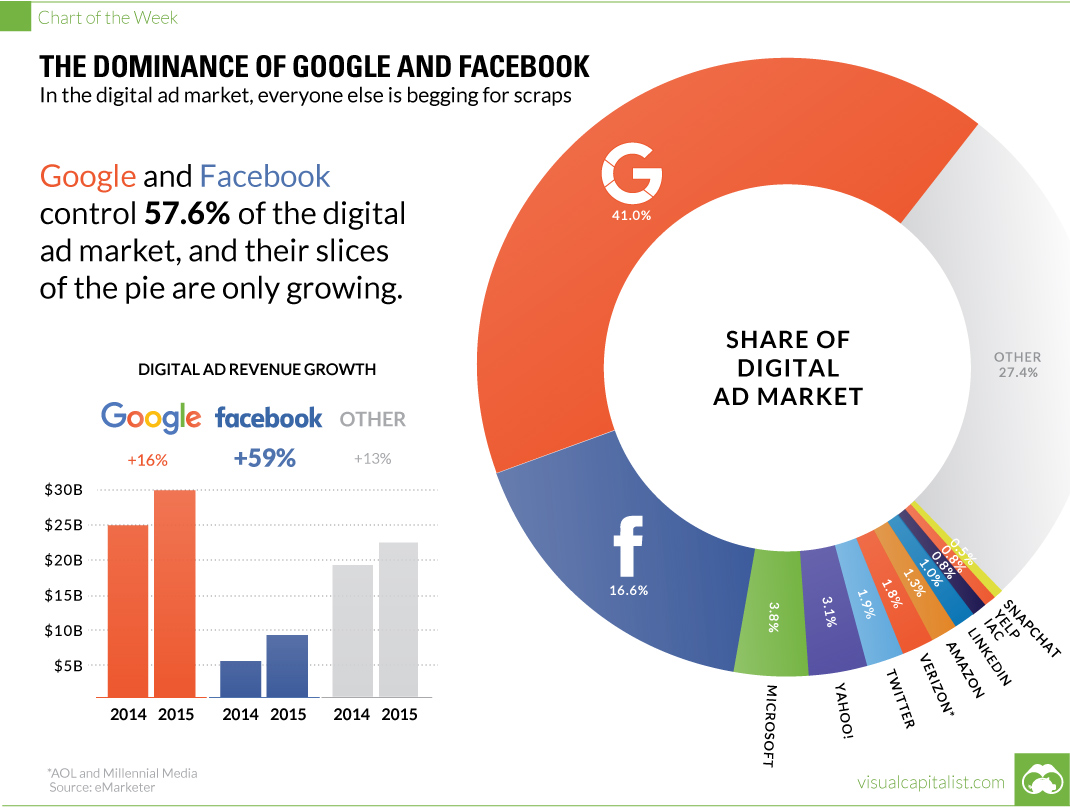
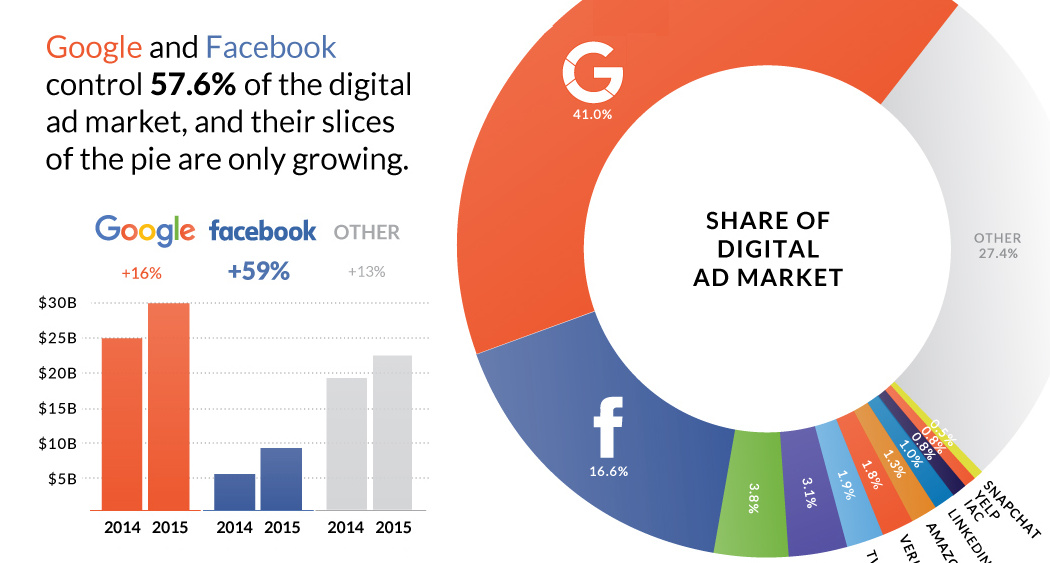
For digital ads, everyone else is begging for scraps.
The Chart of the Week is a weekly Visual Capitalist feature on Fridays.
Over the next couple years, digital advertising is expected to pass television to become the largest ad market in existence.
One would think that this simple fact should translate to a bright future for many publishers, but the reality seems to be quite different. That’s because digital advertising is increasingly dominated by just two players, and everyone else is just begging for scraps.
The Ad Duopoly
Today, close to $0.60 of every dollar spent on digital advertising goes to Google and Facebook.
The crazy thing is that these are still early days, especially for Facebook, which grew its digital ad revenue by 59% last year. The social media company recently smashed Wall Street’s expectations again, as it revealed that Facebook’s mobile business alone was bigger than its entire business back in 2015 Q3.
This lopsided growth is quite the juxtaposition to the media stalwarts of the world.
Iconic brands such as The New York Times have struggled to make a full transition to digital, making only $200 million per year from the online ad side of their business. That makes the Times, along with other traditional media companies like News Corp, Time Inc, or Hearst, too “small” to even show up on our chart.
It’s a Platform Kind of World
In the digital advertising landscape, it’s all about the power of platforms. The majority of our chart is loaded with companies that have created (or bought) platforms full of user-generated content that people use every day. Facebook, YouTube (owned by Google), Twitter, Snapchat, LinkedIn, and Yelp all make the cut on our chart, because they have gained massive scale.
In a nutshell, this is why the best technology companies have overtaken names like Exxon Mobil or Walmart to be the largest by market capitalization in the world.


Technology
All of the Grants Given by the U.S. CHIPS Act
Intel, TSMC, and more have received billions in subsidies from the U.S. CHIPS Act in 2024.


All of the Grants Given by the U.S. CHIPS Act
This was originally posted on our Voronoi app. Download the app for free on iOS or Android and discover incredible data-driven charts from a variety of trusted sources.
This visualization shows which companies are receiving grants from the U.S. CHIPS Act, as of April 25, 2024. The CHIPS Act is a federal statute signed into law by President Joe Biden that authorizes $280 billion in new funding to boost domestic research and manufacturing of semiconductors.
The grant amounts visualized in this graphic are intended to accelerate the production of semiconductor fabrication plants (fabs) across the United States.
Data and Company Highlights
The figures we used to create this graphic were collected from a variety of public news sources. The Semiconductor Industry Association (SIA) also maintains a tracker for CHIPS Act recipients, though at the time of writing it does not have the latest details for Micron.
| Company | Federal Grant Amount | Anticipated Investment From Company |
|---|---|---|
| 🇺🇸 Intel | $8,500,000,000 | $100,000,000,000 |
| 🇹🇼 TSMC | $6,600,000,000 | $65,000,000,000 |
| 🇰🇷 Samsung | $6,400,000,000 | $45,000,000,000 |
| 🇺🇸 Micron | $6,100,000,000 | $50,000,000,000 |
| 🇺🇸 GlobalFoundries | $1,500,000,000 | $12,000,000,000 |
| 🇺🇸 Microchip | $162,000,000 | N/A |
| 🇬🇧 BAE Systems | $35,000,000 | N/A |
BAE Systems was not included in the graphic due to size limitations
Intel’s Massive Plans
Intel is receiving the largest share of the pie, with $8.5 billion in grants (plus an additional $11 billion in government loans). This grant accounts for 22% of the CHIPS Act’s total subsidies for chip production.
From Intel’s side, the company is expected to invest $100 billion to construct new fabs in Arizona and Ohio, while modernizing and/or expanding existing fabs in Oregon and New Mexico. Intel could also claim another $25 billion in credits through the U.S. Treasury Department’s Investment Tax Credit.
TSMC Expands its U.S. Presence
TSMC, the world’s largest semiconductor foundry company, is receiving a hefty $6.6 billion to construct a new chip plant with three fabs in Arizona. The Taiwanese chipmaker is expected to invest $65 billion into the project.
The plant’s first fab will be up and running in the first half of 2025, leveraging 4 nm (nanometer) technology. According to TrendForce, the other fabs will produce chips on more advanced 3 nm and 2 nm processes.
The Latest Grant Goes to Micron
Micron, the only U.S.-based manufacturer of memory chips, is set to receive $6.1 billion in grants to support its plans of investing $50 billion through 2030. This investment will be used to construct new fabs in Idaho and New York.

-

 Brands6 days ago
How Tech Logos Have Evolved Over Time
-

 Demographics2 weeks ago
The Smallest Gender Wage Gaps in OECD Countries
-

 Economy2 weeks ago
Where U.S. Inflation Hit the Hardest in March 2024
-

 Green2 weeks ago
Top Countries By Forest Growth Since 2001
-

 United States2 weeks ago
Ranked: The Largest U.S. Corporations by Number of Employees
-

 Maps2 weeks ago
The Largest Earthquakes in the New York Area (1970-2024)
-

 Green2 weeks ago
Ranked: The Countries With the Most Air Pollution in 2023
-

 Green2 weeks ago
Ranking the Top 15 Countries by Carbon Tax Revenue